

SolarWinds® NetFlow Traffic Analyzer (NTA) is a multi-purpose tool useful for a wide range of bandwidth monitoring and management purposes. It integrates with SolarWinds Network Performance Monitor (NPM) to provide a comprehensive network monitoring tool.
NTA Key Features
Installation System Requirements
Installation Process
Best Practices for Network Traffic Monitoring
Configuration and Using NTA
SolarWinds NTA Review Conclusion
You can also integrate the NPM and NTA solution with other SolarWinds tools, such as SolarWinds Network Configuration Manager. These tools are all part of the SolarWinds Orion® Platform, which we’ll look at more in-depth later in this article. For this SolarWinds NetFlow Analyzer review, I’ll focus on NTA and what it can do.
Essentially, NTA collects two kinds of data: interface-level flow data and CBQoS (Class Based Quality of Service) data. It then looks at the performance data NPM collects from SNMP and WMI sources and combines the two data streams to produce one set of data you can analyze and examine. This data can be processed into graphs and reports, so you can have complete visibility into your network, in both a historical sense and in terms of its current status.
In addition, the combination of NPM and NTA yields a selection of tools for multi-vendor networks. This includes network traffic and performance analysis, bandwidth monitoring, customizable reports, and a range of alerts and alerting options, as well as the ability to optimize the policies you apply to your networks and infrastructure.
NTA Key Features
Now let’s look at the key features of NTA. Network Traffic Analyzer has several utilities to help with network traffic monitoring, each of which has a special function and key focus regarding network flows. Following this SolarWinds NetFlow Analyzer review, I’ll go into detail about how NTA works in combination with NPM, and some alternatives to these two tools.
Bandwidth Monitoring
One of NTA’s primary features is the capacity to monitor bandwidth precisely and in a useful way, so you can determine which protocols or applications are using up the most bandwidth. You can see if a user is hogging bandwidth, or if a user group or IP address is consuming a lot. This can help you to pinpoint users who may need instruction in company internet and application use policies and highlight rogue applications or security issues causing bandwidth spikes.
Originally named for its ability to monitor Cisco NetFlow, NTA has since expanded to monitor a range of flow data types, including Juniper JFlow, sFlow, Huawei NetStream, and IPFIX. It also uses Cisco NBAR2 to enhance root cause identification, and SolarWinds User Device Tracker for pinpointing devices. NTA can view both IPv4 and IPv6 flow records, and it supports devices from Cisco, Palo Alto Networks, HP, Juniper, Huawei, Extreme Networks, Nortel Networks, and more.
Traffic and Performance Analysis
NTA can also perform network traffic analysis. By collecting large amounts of data on your bandwidth flows, it can easily baseline performance, and as a result help you troubleshoot issues and discover the root cause as quickly as possible. It provides your performance data in a customizable single-pane-of-glass dashboard.
The interface is intuitive, and you can drag and drop performance metrics on a common timeline, called the PerfStack™ dashboard. This allows you to see the metrics alongside each other, and more easily spot correlations or potential causes behind a problem. Sometimes one performance issue can trigger another, and without tools like PerfStack, you might not be able to see the thing you’re looking at is a symptom rather than the main problem.
Alerting
NTA includes a powerful alerting feature. If there’s a rapid or unexpected change in application or network traffic, it can alert you to the issue. This can help to spot devices that have stopped sending flow data, rogue applications, and even security issues that might have slipped through the firewall.
In addition, NTA includes interface alerting, which lets you know if an interface is exceeding its allocated bandwidth utilization threshold. If you have a “chatty” application, NTA can help you pinpoint which one it is, and you might be able to swap out software for lighter versions without as much bandwidth use.
Reporting
When dealing with management, you likely need to furnish reports showing your IT team is optimizing network performance, fixing issues, and keeping bandwidth flows constant. You can use the reports provided by NTA for optimizing and managing bandwidth, including determining your actual needs when compared to your projected or expected ones.
From a cost standpoint, clear reports can help you to determine whether you’re paying for bandwidth you don’t need, assist with capacity planning, and show you if you’re facing slowdowns due to insufficient bandwidth. As a result, you can manage your networks and applications more efficiently, and with less wastage and fewer slowdowns.
Optimization of CBQoS Policies
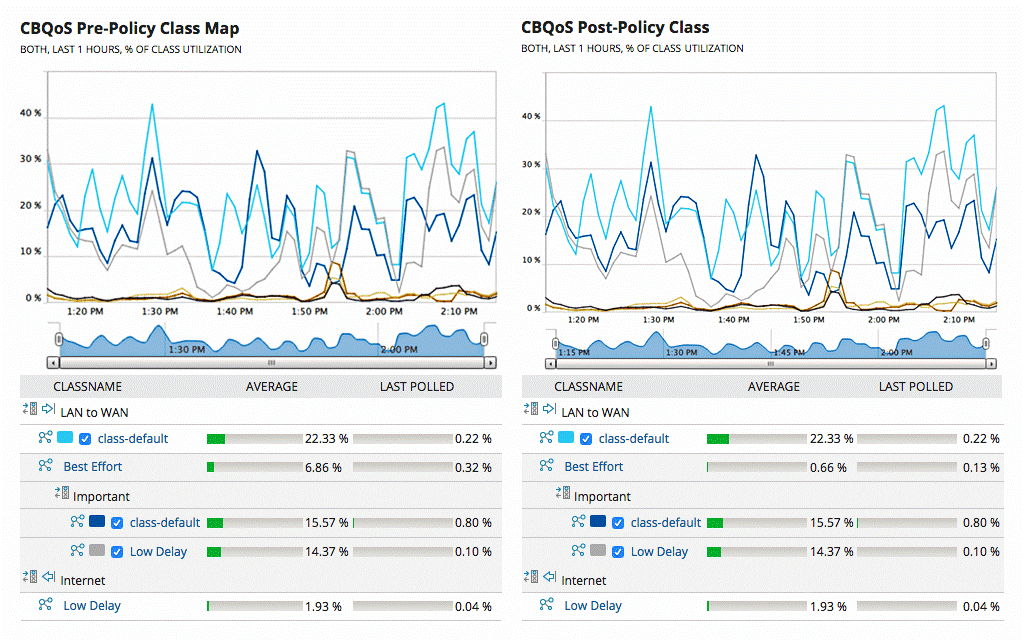
CBQoS, short for Class Based Quality of Service, is a Cisco feature providing information about quality of service policies. NTA can help you optimize these QoS policies by providing the ability to segment traffic based on which policies apply. This means you can effectively measure how your policies are performing, and whether you need to change anything to provide better service to your end users. For best service quality, you always want to make sure your business-critical applications have the highest priority when it comes to bandwidth. Applying QoS policies can help you segment your applications and traffic to deliver what you want. NTA helps ensure these policies function correctly.
You can also create a map of bandwidth usage by class, which is a great visualization for looking at which classes and policies are high-bandwidth areas. It provides pre- and post-policy maps, so you can directly see the effect of your policy. To use this feature, you need to make sure you have a connection to a SQL Server, which I’ll discuss below in the system requirements section.
Capacity Planning
Finally, NTA includes useful features for capacity planning. As mentioned, the tool’s reporting features can help you determine if you’re over- or under-utilizing your current bandwidth; in addition, it can help simply by allowing you to view historic bandwidth usage. With this capability, you can identify periods or applications with peak usage, and use traffic shaping measures or swap out applications or devices as needed.
Installation System Requirements
To install SolarWinds NTA on your system, you’ll need to make sure you meet the minimum requirements. As noted above, you can use the NTA module with SolarWinds Network Performance Monitor, as part of the SolarWinds Orion Platform. The Orion Platform is the brains behind the operation: it controls the settings and alerts, navigation through the different tools, and centralized administration dashboards, with access control settings presented in a unified user interface.
NTA and NPM both run on Windows operating systems. To run the Orion Platform, you’ll need to install both the Windows Server Orion App Server and the SQL Server Orion Database Server. In addition, you’ll need to install the SQL Server Flow Storage Database, which requires you to have an instance of Microsoft SQL Server 2016 Service Pack 1 or later installed.
Each installation’s requirements will depend on exactly how many network elements you plan to monitor. For NTA, SolarWinds recommends you use either Microsoft Windows Server 2016 or Microsoft Windows Server 2019. If you’re using more than one polling engine, you need to ensure they’re all installed on 64-bit operating systems. You should also ideally have systems with a quad core CPU, and between 40 and 400GB of hard drive space, depending on which version or license of NTA and NPM you are using. For example, for an enterprise-level setup, you would need significantly more space. SolarWinds also recommends between 16 and 128GB of RAM, depending on license and number of elements.
Before installing NTA, you need to have the right version of NPM installed on the same server. To install both NPM and NTA, you can purchase a license for SolarWinds Bandwidth Analyzer Pack, which includes both tools in one.
Installation Process
Once you’ve made sure you meet the system requirements, installing and setting up NTA is relatively simple. First, you need to make sure you have NPM installed.
- Download Network Performance Monitor from the SolarWinds website and unzip the installer folder.
- Once you run the installer, it will check for prerequisites and install any system packages or missing but necessary software. If all the prerequisites and pieces of system software are installed, then the configuration wizard will launch.
- The configuration wizard is a simple click and follow-through wizard that allows you to provide the necessary information to set up the software. Once you’ve done so, it will begin an auto-discovery process for all the connected devices on your network.
- If you’ve already preconfigured your network devices to respond to queries for flow data and the metrics NTA is trying to measure, it will help you complete this discovery process. Make sure SNMP and WMI are enabled on all your network devices and hosts you want the software to map. You’ll also need the flow protocols to be enabled, so this flow data can be sent to NTA for monitoring and analysis.
- The next step is to look at all the devices been discovered and decide which to import into the Orion Platform database. The devices you choose to import will be actively monitored. SolarWinds recommends you begin a trial with a key set of devices and servers, to test out your configuration and setup. You can then expand the devices covered. To find your known devices once you’re looking at NPM, click on “My Dashboards,” then “Network,” and then “Network Summary.”
After the installation of NPM is complete, you can download NetFlow Traffic Analyzer. This is installed to the Orion App Server using the same process. You can also move the flow storage database to its own separate server if you choose. In addition, it’s important to configure and optimize NTA to follow best practices for network traffic monitoring.
Best Practices for Network Traffic Monitoring
One of the first things you should do is configure NPM and NTA to collect as much data as possible, to identify clear baselines for your network performance. Below are the key best practices for using these tools.
- Monitoring: Monitor availability, disk space, utilization rates, and event logs, as well as applications and servers.
- Mapping: Use mapping tools to obtain a clear visual understanding of how your network functions, how all network devices and applications are connected, and where your dependencies are.
- Alerting: When you set up your alerting processes, be sure to configure them with the appropriate level of priority. If you’re constantly overwhelmed with alerts, you won’t be able to pick up on the urgent ones versus the lower priority ones. You should ensure during work hours you’re alerted within a clear priority system, and outside of work hours only highly critical alerts come through.
- Reviewing reports: Institute a regular review of your reports, so you can undertake accurate and useful configuration management and capacity planning. By reviewing reports, you have the chance to pinpoint which configuration choices have been effective and which haven’t, check on network components at capacity, and see how your responses to malfunctions have worked out.
- Escalation planning: Finally, you need to make sure you have an escalation plan in place for dealing with issues when they arise. Going through the right communication channels will help your company to resolve problems faster, while keeping your staff from wasting time on problems outside their sphere of expertise.
Configuration and Using NTA
In my view, NTA is easy to use. Still, you should familiarize yourself with a few dashboards and tools.
First, you need to configure SolarWinds NetFlow Analyzer for everyday use, so it monitors as much of your bandwidth data as possible. The best way to detect and troubleshoot problems is to ensure you collect data continuously, both to set clear and accurate baselines and to more easily highlight issues as soon as they arise.
SFlow Collection and Analysis
The SolarWinds NTA sFlow collector tool collects sFlow data and analyzes it to identify high-bandwidth users, applications, or protocols. It also tracks application traffic and analyzes traffic patterns over time. To view all this information, the primary tools you have at your disposal are the web console, control views, alerts, and reports. If you want to look at the interface, you can access an interactive NTA demo on the SolarWinds website.
Dashboards
The web console has several dashboards— “Home,” “Network,” “Applications,” and so on. In the Home screen you can see an overview of your network nodes, operations, alerts, WAN errors, event summaries, hardware health, groups, transactions, and service incidents. It essentially provides all the key information in easy-to-understand segments, with color-coding calling your attention to any problems or alerts you need to take note of. It also includes graphs and charts to help you make sense of the information. The other tabs and screens provide more detailed information about each part of your network setup.
NetFlow Analysis
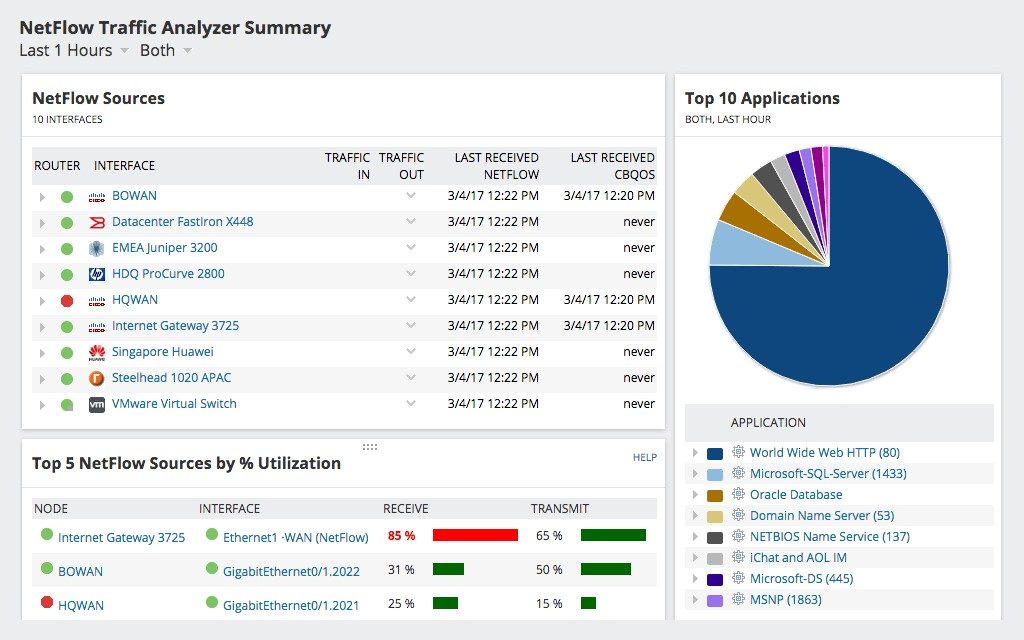
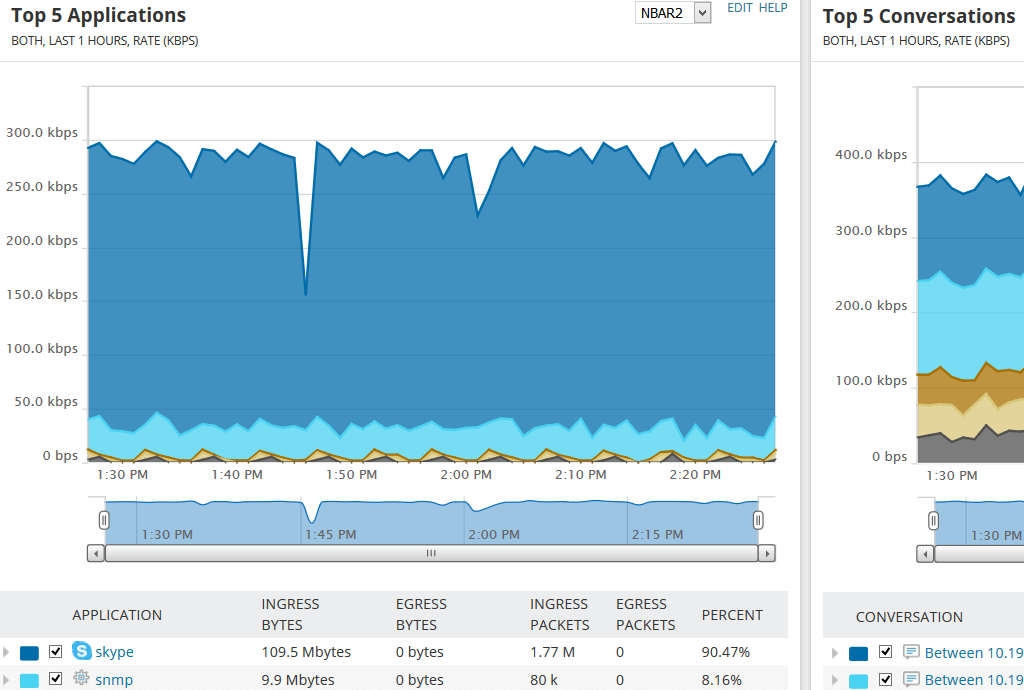
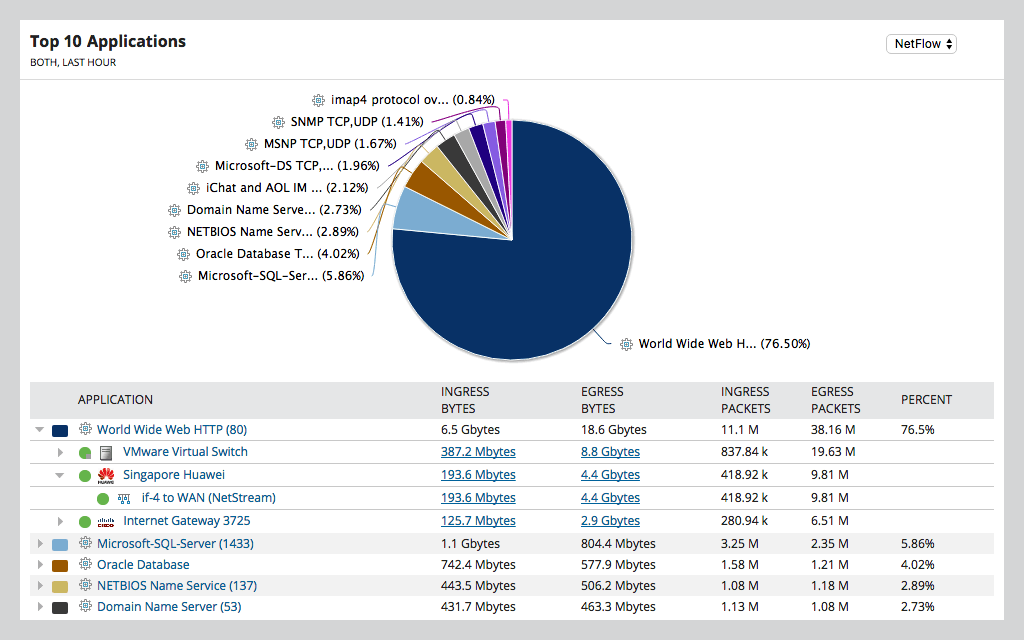
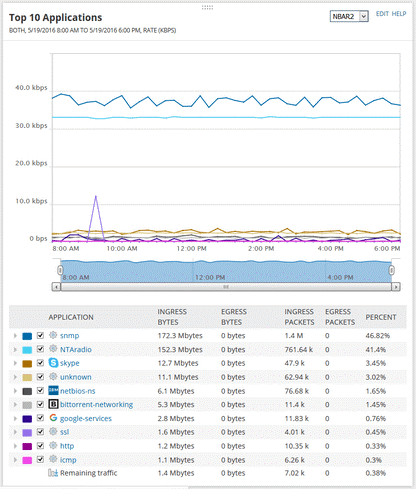
Using NTA with NPM enables a dedicated NetFlow tab, which includes your NetFlow sources, “Top 10 Conversations,” “Top 10 Endpoints,” and “Top 10 Applications.” This makes it easy to identify the high-bandwidth use points in your network and to see when any one of these rapidly spikes to the top of your list. The NetFlow tab also includes a list of the top 25 latest traffic analyzer events. This list shows you your alerts and lets you know of any performance issues based on the thresholds you have set.
The graphics included are interactive, so you can mouse-over graph points or pie chart segments to get more detailed information.
Customization
It’s also easy to customize views and dashboards to fit what you need most, so you can get rid of clutter or unnecessary information. You can choose to have alerts show up in your triggered alerts list, or you can have events and alerts sent to you by email or by text. When you get an alert, you can check it out in more detail, and within the alerts list you can also turn off alerts, manage them, or look at what threshold triggered the notification.
Reporting
You can also use the web console to produce reports. You can group and organize your reports by category, and then view each report group in a list. This way you can easily drill down to find the report you’re looking for, without having to search through long lists.
SolarWinds NPM and NTA can report on numerous metrics. These include node availability by year, current node status, events, hardware health, historical reports, inventory, configuration, and virtualization. The wide range of metrics on which it’s equipped to report is useful for showing management or other team members the success of your optimization and management efforts.
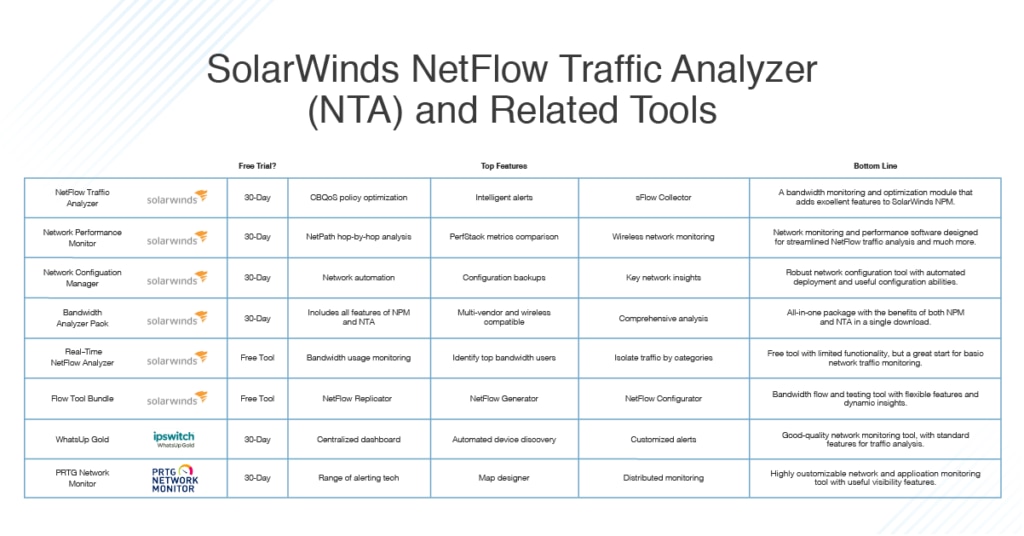
Free Alternatives to NTA
SolarWinds offers a 30-day free trial of both NTA and NPM, so you can try the full software before deciding to unroll it throughout your system. The company also offers some completely free tools worth checking out.
SolarWinds Real-Time NetFlow Analyzer
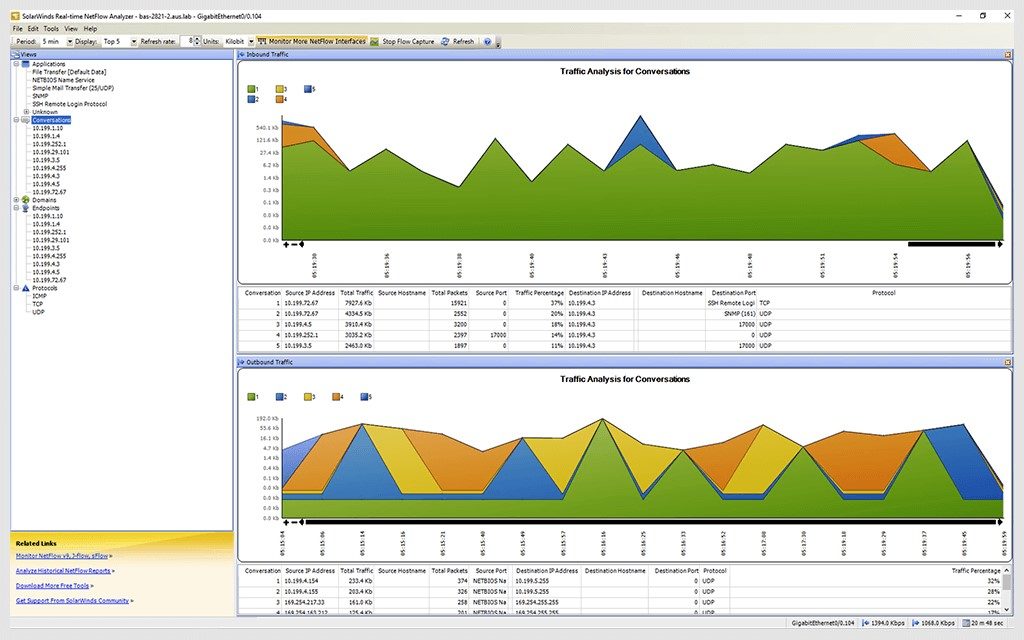
Smaller networks may not need the full power of NTA. If this is the case, you might want to look at Real-Time NetFlow Analyzer, a completely free SolarWinds product. It has the same feel as NTA, but it comprises a smaller feature set. For example, it doesn’t include the CBQoS monitoring and analysis tools, and it doesn’t enable network traffic forensics. However, it has most of the other features and works well as a basic network and bandwidth monitoring utility.
SolarWinds also offers Flow Tool Bundle, a free toolkit for you to distribute, test, and configure bandwidth flows. It consists of three tools:
- NetFlow Replicator can help you distribute flow data or configure flow data packets by sampling them randomly to gather information about your bandwidth and network flows.
- NetFlow Generator creates simulations of network flow data, so you can test devices or behaviors such as firewall settings or network entities such as load balancers.
- Finally, Flow Tool Bundle includes NetFlow Configurator, which allows you to remotely configure and activate NetFlow v5 on Cisco devices, so you can send records to your collector.
All these tools help you gain greater insight into how your network is being used and how it functions, so you can optimize performance and troubleshoot issues as they arise. They can be used alongside NTA and NPM to complement their functionality.
Another approach is to download SolarWinds Bandwidth Analyzer Pack, discussed above. BAP gives you NPM and NTA in a single package. When compared to SolarWinds Flow Tool Bundle, BAP provides significantly more features, as it’s the combination of the two enterprise-level tools. It includes a 30-day free trial, which means you can consider it alongside SolarWinds Flow Tool Bundle before making a commitment.
NTA Competitors and Alternatives
NTA’s two main premium competitors are WhatsUp Gold and Paessler PRTG Network Monitor. I’ll wrap up this article with a brief review of each of these tools, to give you a sense of how they measure against the SolarWinds offerings.
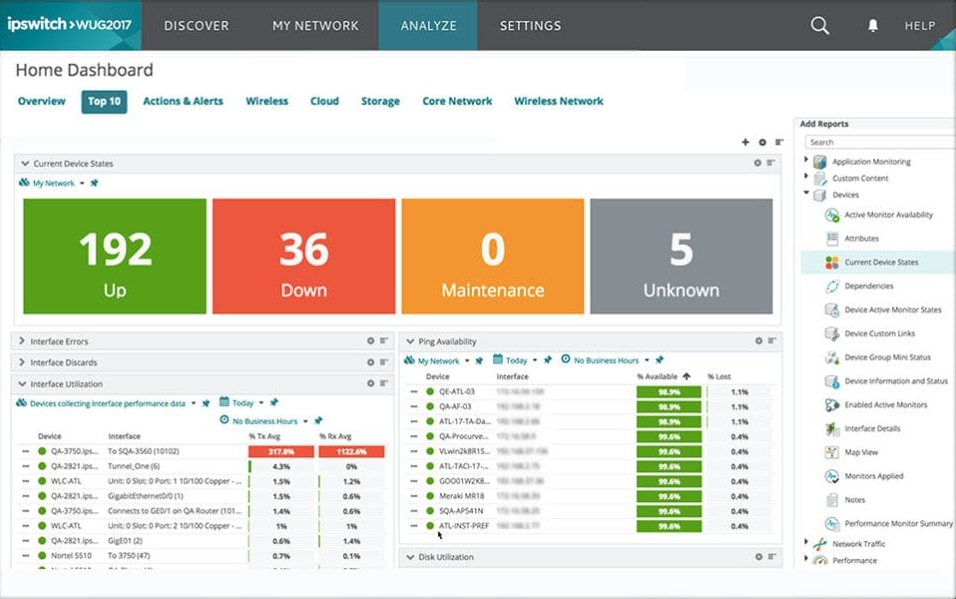
WhatsUp Gold provides the same kind of functionality as NPM used in tandem with the NTA module. It includes some useful core features, including tools to check network device availability and track bandwidth usage, and several automation tools to help you configure network setups more easily, manage assets, and monitor logs and events.
WhatsUp Gold provides a unified, centralized dashboard in which all your relevant network information is displayed, so you can see important details at a glance. The dashboard is interactive, and you can operate each part of your monitoring solution from this central location. You can also personalize the dashboard to suit your needs—for example, by swapping out monitoring metrics and tables like widgets.
With automated device discovery you can collect and view information about all your devices and get data on everything installed on each device. The auto-discovery capabilities also give you information on device hardware data metrics like type, vendor, and serial number, and firmware and hardware health. Furthermore, the network maps created from this discovery make it easy to see and manage your network in a more visual way. You can use different overlays to see which infrastructure is virtual and which is physical, and you can navigate between the views to quickly spot problems and understand how one device may affect others, or how an outage in one section could affect another section.
WhatsUp Gold includes alerts you can configure to trigger when device states change or when a monitor flags an issue deviating from the baseline readings. You can customize notifications to align with the issues you see as the biggest risks, so application- or service-critical problems can be fixed as soon as possible, before they affect your end users.
WhatsUp Gold offers a free trial.
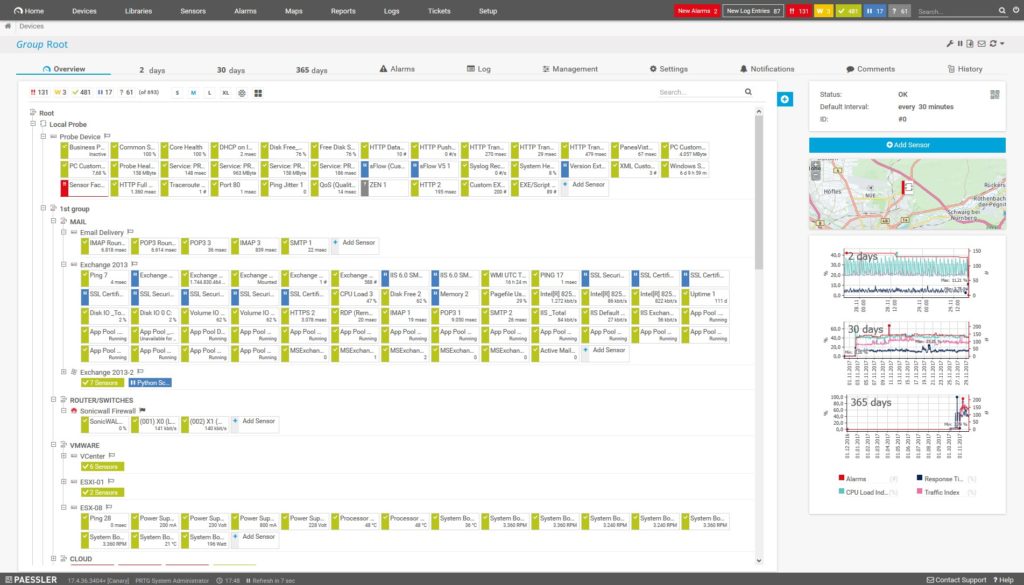
PRTG Network Monitor, by Paessler, is another good tool along the lines of NTA. It has several interfaces, including a web application, a desktop app, and an app for Android and iOS. These interfaces can be used simultaneously, and they also allow remote access.
PRTG includes alerting technologies so you can receive alerts in the way you prefer, whether via SMS, email, in-application alert, or other method. Alerts can be scheduled to suit your needs—you can choose to get them at certain times of day, and you can set up dependencies to avoid huge floods of alarms. It’s also possible to write your own custom notifications, to focus on what’s most critical to you.
PRTG includes some nice visualizations. The map designer allows you to create maps of your network, including information on each component in the network and the dependencies between them. The tool comes with more than 300 different map objects, to help you design a map that most accurately fits your actual network setup.
PRTG Network Monitor includes distributed monitoring solutions, so you can monitor networks spread over large geographic locations or networks separated within your enterprise. You can then get an overview of the entire network in your PRTG console. The tool’s reporting functionalities are robust, with a range of reports available for either specific monitoring data or configurations you’ve set up. You can produce reports on-demand or set up a schedule for regular reporting.
PRTG offers a free version good for up to 100 sensors. There are also paid options, and pricing varies depending on the number of sensors and servers you want the installation for. Each of the paid options is available as a 30-day free trial. After the trial period, it will revert to the free version.
SolarWinds NTA Review
SolarWinds NetFlow Traffic Analyzer has several key features that make it stand out from the competition. If you already have SolarWinds infrastructure in place, such as the Orion Platform and Network Performance Monitor, adding the NTA module is well worth your while. If you don’t have any of the infrastructure in place yet, you can access free trials of everything from the SolarWinds website.
NTA integrates seamlessly into these larger systems, making it easy to use and manage, and you can contact support or view documentation if you want to make configuration or optimization changes. Keeping track of your network bandwidth is important, and NTA is more than capable of meeting your needs in this respect.