Article

Soil Organic Carbon Chemical Functional Groups under Different Revegetation Types Are Coupled with Changes in the Microbial Community Composition and the Functional Genes

1
College of Forestry, Shenyang Agriculture University, Shenyang 110161, China
2
Research Station of Liaohe-River Plain Forest Ecosystem, Chinese Forest Ecosystem Research Network (CFERN), Shenyang Agricultural University, Tieling 112000, China
*
Author to whom correspondence should be addressed.
Forests 2019, 10(3), 240; https://doi.org/10.3390/f10030240
Submission received: 19 January 2019 / Revised: 5 March 2019 / Accepted: 6 March 2019 / Published: 8 March 2019

Abstract

:
Different revegetatiom types can affect the chemical composition of soil organic carbon (SOC), soil microbial community and the functional genes related to carbon cycle. However, the relationships between SOC chemical functional groups and soil microbial communities and the functional genes remains poorly unclear under different revegetation types. Using the solid-state 13C nuclear magnetic resonance (NMR) spectroscopy, we examined changes in the SOC chemical composition of five soils (0–10 cm depth) from Larix gmelinii Rupr. (LG), Pinus koraiensis Sieb. (PK), Quercus mongolica Fisch. (QM), Juglans mandshurica Maxim. (JM), and conifer-broadleaf forest (CB). And the soil microbial community genes related to metabolism of macro-molecular compounds were determined via whole genome shotgun based on Illumina HiSeq. Our results indicated that broadleaf forests (JM, QM) had increased the contents of soil total carbon (C), total nitrogen (N), dissolved organic carbon (DOC), and microbial biomass carbon (MBC), compared with coniferous forests (LG, PK) and the conifer-broadleaf forest (CB). While, the coniferous forests generated a lower O-alcoxyl C, a higher alkyl C, and the ratio of alkyl C/O-alkyl C than broadleaf forests. A total of four kingdoms were identified via whole metagenome shotgun sequencing, including eight archaea, 55 bacteria, 15 eukaryota, and two viruses, giving a total 80 phyla. The contents of alkyne C, phenolic C, methoxyl C, COO/NC=O, and alkyl C were strong related to the composition of soil microbial community and their contents illuminated a major part of the variation in soil microbial composition. We detected seven corresponding macro-molecular compounds of different organic carbon functional group, and 244 genes related to metabolism across all samples, and soil total C, total N, and DOC could be the main factors for microbial functional gene composition. Interestingly, the relative abundances of different SOC chemical functional groups, the phylogenetic distance for microbes, the genes of C cycling based on the KEGG database, and the relative abundance of genes related to metabolism of macro-molecular compounds of different SOC chemical functional groups under different revegetation types all could be divided into three groups, including PK plus LG, JM plus QM, and CB. Our results also illustrated that variations in SOC chemical functional groups were strongly associated with changes of soil microbial community taxa and functional genes, which might be affected by the changes of soil characteristics.

1. Introduction

Soil organic carbon (SOC) is an important indicator of soil fertility and health [1], which is also an important factor affecting SOC stability and consequently C sequestration [2]. The long-chain alkanes had greatest correlation with fresh organic matter, which present higher correlation with SOC levels than others [3]. At present, the global warming caused by the rise of atmospheric CO2 concentration has been widely concerned by countries all over the world. Revegetation is generally believed to be a main measure to promote SOC sequestration, which plays a vital role in reducing atmospheric CO2 [4,5], and slowing down climate warming [6]. The C sequestration of global afforestation and reforestation every year can reach 0.584 Pg C [7], and the stability of SOC is one of the key mechanisms of C sequestration.
Over the decades, in order to discuss the stabilization mechanism of SOC, researchers have divided soil organic carbon into different stable or active carbon pools from the perspective of soil ecology [8]. While, the quality and function, and the stability of SOC largely depend on the chemical composition and molecular structure of SOC [9]. Previous studies have shown that different revegetation types have different influences on the distribution of soil C pools [10], especially between coniferous and broadleaf forests [11,12,13]. In previous decades several studies have focused on comparing SOC at different vegetation succession stages, while there are few reports concerning the SOC chemical composition under different revegetation types. Thus, there is a need for further to investigate the stability of SOC under different revegetation types for revealing the mechanism of C sequestration in the forest system, especially because revegetation is considered to be an effective way to mitigate climate change [14]. With the development of research, the chemical analysis methods, such as Fourier Transform Infrared (FTIR) and the solid-state 13C NMR spectroscopy, were combined with traditional methods in soil science methods (aggregate and size-density fractionation and chemical characterization) to identify the chemical structure characteristics of soil organic carbon composition, providing a new idea for exploring the stabilization mechanism of soil organic carbon [15,16]. Under the context of global change, studying and revealing SOC chemical structure characteristics and influencing factors on a small scale has important theoretical and practical significance for accurately estimating greenhouse gas emissions and the potential capacity of soils to carbon sequestration.
SOC accumulation is controlled by two factors, including organic C input and SOC degradation rates. It has been proposed that the C accumulation may be more closely coupled to soil microbial decomposition processes than to organic C input [17]. SOC degradation rates were generally controlled by the molecular structure of SOC, and environmental and biological factors [18], such as microbial community composition and litter quality [19,20], which is closely related to soil carbon dynamics [21]. Soil microorganisms are vital components of terrestrial ecosystems and play extremely significant roles in the biogeochemical cycles [22,23,24], ecosystem productivity, function, stability, and ecological recovery [25]. Small changes in the rate of microbial decomposition of SOC could alter the feedback effect of terrestrial ecosystems on the atmosphere. In soil, the metabolism of macromolecular compounds, such as wax, keratin, lignin, hemicellulose, cellulose, amino sugar, etc. corresponding to SOC functional [26], is particularly important in the overall metabolism of SOC [27]. Therefore, analysis of the relationships between genes related to the metabolism of macro-molecular compounds and SOC functional groups could provide insights into C cycling driven by soil microorganism.
Soil microorganisms can not only affect carbon fixation by participating in the decomposition of soil organic matter and the mineralization process of nutrients, but also affect the stability of soil carbon by synthesizing more stable organic materials, which are key hub connecting the change of vegetation community [28,29]. Due to the different relative abundance of various genes related to carbon metabolism possessed by different microbial community structures, the carbon metabolism functions of different microbial communities are different, thus influencing soil C cycling in forest ecosystem [30]. Previous studies reported that SOC can explain an important part of the variations of soil microbial functional diversity, particularly on the soil surface [31]. Dissolved organic carbon (DOC), as one of the components of SOC, has certain solubility, moves faster, unstable, oxidized, easily decomposed and easily mineralized in the soil, the mobility of which was controlled by a variety of soil chemical and hydrologic factors, and is closely related to the change of soil fungal community composition [32]. Identically, changes in SOC fractions are strongly linked to soil microbial community composition following afforestation [33]. However, to our knowledge, few studies have been conducted to the relationships between the SOC chemical composition and the genes related to decomposition and transformation of organic carbon by specific functional microorganism. Therefore, further study will be needed to expound on how soil microbial functional taxa regulate SOC fractions under different revegetation types, and the correlation mechanism between genes of carbon cycle and environmental factors.
The Baishilazi Nature Reserve, established in 1988, is settled in the eastern mountainous region of Liaoning Province, China, belonging to portion of the Changbai mountain system. Broadleaf forest of Pinus koraiensis Sieb. was the original vegetation, which were badly damaged due to the over-exploitation of the past 100 years. For the time being, natural secondary forests and coniferous forests are the main vegetation, which provides a unique opportunity to investigate the SOC chemical functional groups and soil microorganisms under different revegetation types with the same climatic conditions. Numerous studies have investigated the changes in SOC contents [34] and SOC components [35] under different forests. Also, previous studies have reported that the soil bacterial [36] and fungal [37] community presented significant differences among different revegetation types, while there are few studies concerning the impacts of different revegetation types on the SOC chemical composition in this area. The relationships among SOC chemical functional groups, soil microbial community, and the genes linked to carbon cycling were unclear. Therefore, the solid-state 13C NMR spectroscopy and whole genome shotgun based on Illumina HiSeq were used to investigate the correlations between SOC chemical functional groups, and soil microbial community, as well as genes related to carbon cycling under different revegetation types. Specifically, we tested the following hypotheses: (1) changes of soil microbial community composition are closely related to the changes of the SOC chemical functional groups as affected by soil characteristics (2) shifts in genes related to metabolism of macro-molecular compounds are linked to the changes of the SOC chemical functional groups.

2. Materials and Methods

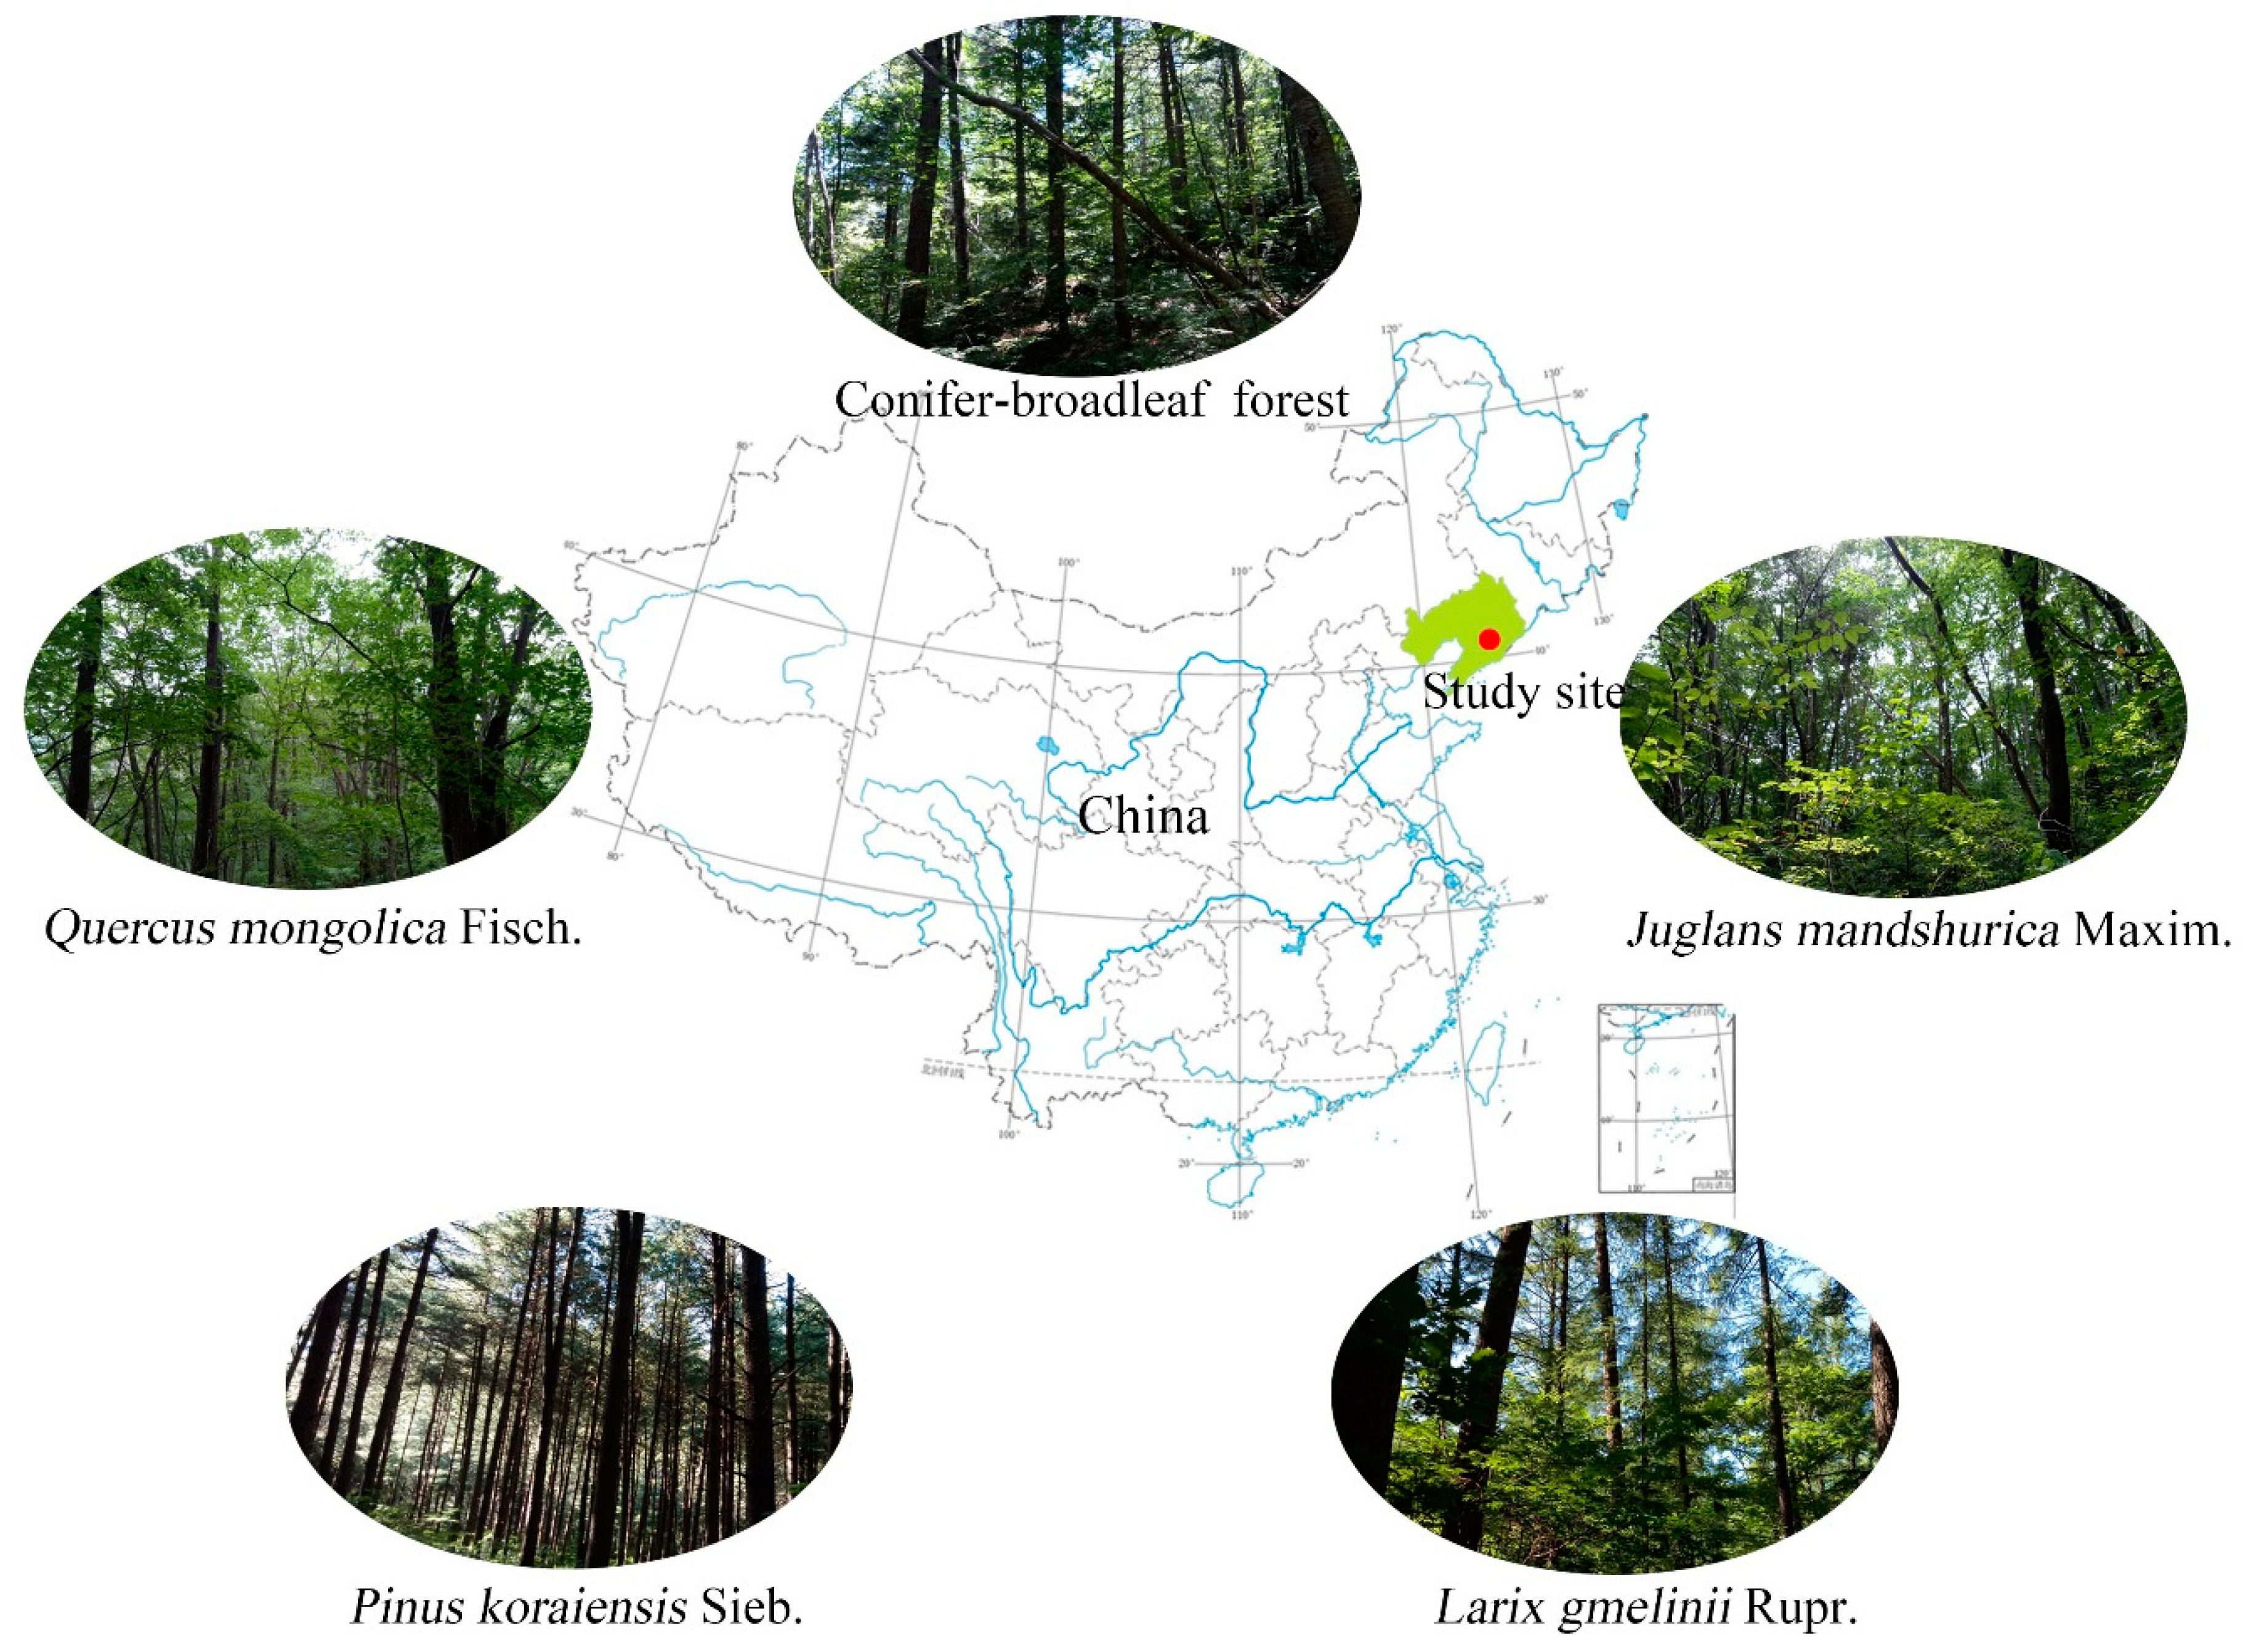
2.1. Experiment Site

The research area was seated the Baishilazi Nature Reserve (40°50′00″–40°57′12″ N, 124°44′07″–124°57′30″ E), northwest Liaoning Province, China, which belongs to the mountain range of the Changbai Mountain. The total area encompasses 7407 hm2 and it has unique and rich biodiversity and has important scientific value and in ecological status China [38]. The soil type is characterized by Eutrochrepts soil [39]. Under a continental monsoon climate with strong diurnal temperature variation, warm but wet summers (from 6 July to 20 August), and long cold winters (from 16 October to 25 April), the annual average precipitation is 1158 mm. The mean annual temperature of 6.4 °C, with a maximum of 38.1 °C in July and a minimum of −26.8 °C in January.

2.2. Soil Samples Collection

Soil samples were collected from Larix gmelinii Rupr. (LG), Pinus koraiensis Sieb. (PK), Quercus mongolica Fisch. (QM), Juglans mandshurica Maxim. (JM), and conifer-broadleaf forest (CB) stands after removing the plant residue (Figure 1). At each forest type, soil samples were collected from three plots (20 m × 20 m) with the same site conditions and the distance between each sampling plot was more than 100 m (In the Baishilazi Nature Reserve, there are not separate occurrences ("stands") for each revegetation type in different locations for true independent replication, so, three plots were located in one stand of each revegetation type). The “S” strip sampling method was used to ensure the representativeness of soil samples in each plot. The samples of 15–20 points within one plot were mixed together to obtain one composite sample per stand with the use of a soil auger (8 cm in diameter, 10 cm deep), giving a total of 15 soil samples in five different revegetation types. In the laboratory, the soil samples were mixed together and divided into two parts. One part was air-dried and sieved through 2-mm mesh for soil chemical analyses. The second part was sieved through a 2-mm mesh to remove roots and other debris. The <2 mm soil fraction was divided into two subsamples. One portion was stored at 4 °C for the measurement of microbial biomass carbon (MBC), and DOC, and the other portion was stored at −80 °C for DNA extraction.

2.3. Determination of Soil Characteristics

The measure of soil pH was carried out using a pH meter (Tp310 Benchtop) after shaking a soil-water (1:5 w/v) suspension for 30 min [40]. Soil total N and total C were determined by an Elemental Analyzer (Elementar, Germany) [41]. Soil total P were digested by HClO4-H2SO4 and determined by the method of molybdenum-blue [42]. Available P was extracted using 0.5M NaHCO3 and measured by the molybdenum-blue method [43]. The determination of hydrolysable nitrogen was used to alkali-hydrolysed reduction diffusing method [44]. The concentration of dissolved organic carbon (DOC) was estimated from fresh soil with deionized water (1:5 soil: water) [45] and measured using a multi N/C 3100 TOC analyzer (Analytik Jena, AG, Jena, DE). Contents of soil ammonium nitrogen (NH4+-N) and nitrate nitrogen (NO3-N) were extracted with KCl and determined using an AA3 Continuous Flow Analytical System (SEAL AA3, Germany) [46]. Soil microbial biomass carbon (MBC) was extracted with fresh soil samples using a chloroform fumigation-extraction method [47], and measured by a TOC analyser.

2.4. Cross Polarization Magic Angle Spinning (CPMAS)-13C NMR Analysis

In order to improve the accuracy of the signal-to-noise ratio of the spectrum by removing mineral matter and paramagnetic material, prior to nuclear magnetic resonance analysis, soil samples were pretreated with hydrofluoric acid (HF) according to Schmidt [48]. Soil samples (8 g) were shaken end-over-end tube with 50 mL of 10% HF for 1 h (25 °C, 100 r/min). After shaking, the samples were centrifuged at 3000 r/min for 10 min. And the supernatant was poured through a Millipore 5.0 pm Durapore membrane (SVLP04700 PVDF, Durapore®, Boston, MA, USA) filter to recover the light fraction floating in the HF solution. The treatments were repeated 8 more times with shaking times of 4 × 1, 3 × 12, and 1 × 24 h, respectively (through a large number of literature reading, as well as pre-experimental treatment, we found that the soil in this area can be treated with this interval to maximize the removal of soil mineral matter and paramagnetic material.). Each of the extracting solutions was retained for Fe analysis and the remaining soil material was washed four times with water, transferred to a weighed glass vial dried at 75 °C, weighed and ground to pass a 0.2 mm sieve.
The solid-state 13C NMR spectra were obtained on a Bruker AVANCE 400 (Bruker, CH) operating at a 13C resonance frequency of 100 MHz with 4-mm sample rotors. The magic angle spin frequency was 5 kHz, with a contact time of 2 ms, the recycle delay time of 0.8 s, and the scanning times of 140,000 times. The spectra obtained with CP (cross polarization)/TOSS (total sideband suppression) were assigned to different carbon functional groups following the categorizations of Mao et al. [49].

2.5. Metagenome DNA Extraction and Shotgun Sequencing

Total microbial genomic DNA were extracted from 0.5 g soil with the DNeasy PowerSoil Kit (QIAGEN, Inc., Duesseldorf, DE), in line with the manufacturer’s instructions. The quantity and quality of extracted DNA were measured using a NanoDrop ND-1000 spectrophotometer (Thermo Fisher Scientific, Waltham, MA, USA) and agarose gel electrophoresis, respectively. Prior to Illumina sequencing and amplification, all DNA samples were stored at −20 °C. Then, all soil DNA was sequenced on Illumina HiSeq X-ten platform (Illumina, San Diego, CA, USA) with Paired-end, 2 × 150 bp (PE150) strategy. Illumina TruSeq Nano DNA LT Library Preparation Kit (Shanghai Personal Biotechnology Co., Ltd, Shanghai, China) was used to construct metagenome shotgun sequencing libraries with the extracted microbial DNA with insert sizes of 400 bp. These libraries were subjected to paired-end (PE) sequencing, and the basic situation of each library was shown in Table S1.

2.6. Metagenome Sequence Analysis, Assembly, and Functional Annotation

Raw sequencing reads were processed to obtain high-quality reads for further analysis [50]. Once quality-filtered reads were obtained, they were assembled to construct the metagenome for each sample by IDBA-UD (Iterative De Bruijn graph Assembler for sequencing data with highly Uneven Depth) [51]. Statistical analysis of high-throughput initial sequencing and clean data set were in Table S2 and Table S3, respectively. Contigs and scaffold sequences were constructed by a De Bruijn map, and a complete summary of assembly statistics for different revegetation forest soil metagenomes was provided in Table S4. The clean metagenomic sequences were submitted to the SRA at NCBI with the accession number SUB4907174.
Firstly, the above-mentioned spliced assembled metagenomic Scaffolds sequence is divided into five consecutive fuzzy bases “N” and split into scafigs. Subsequently, Cluster Database at High Identity with Tolerance (CD-HIT) is used to assemble all the scaftigs obtained by splicing each sample with 0.95 similarity and coverage greater than 0.9 for merging and redundancy, and the longest sequence is used as the representative of scaftig. The gene abundance of each sample was estimated with soap.coverage (http://soap.genomics.org.cn/) based on the aligned reads number [50]. The obtained scaffolds are predicted by MetaGeneMark [52], and then the corresponding protein sequence is obtained. Subsequently, CD-HIT was used to decompose the above-mentioned protein sequences according to 90% sequence similarity, to obtain non-redundant gene catalog [53]. The functional profiles of the non-redundant genes were obtained by annotated against the Kyoto Encyclopedia of Genes and Genomes Database (KEGG) by using DIAMOND (We introduce DIAMOND, an open-source algorithm based on double indexing that is 20,000 times faster than BLASTASTASTX on short reads and has a similar degree of sensitivity.) alignment algorithm [54].

2.7. Statistical Analysis

The differences of soil characteristics and SOC chemical functional groups under different revegetation types were evaluated by a one-way analysis of variance (ANOVA), followed by the least significant difference (LSD) test performed using SPSS v.19.0 (Chicago, IL, USA) software [55]. The effects of the tree species on SOC chemical functional groups were showed with principal component analysis (PCA) via Canoco for Windows 4.5 (Biometris-Plant Research international, Wageningen, NL). The heatmap representation of the different SOC chemical functional groups contents, the relative abundance of macro-molecular compounds corresponded the SOC chemical functional groups, the relative abundance of genes related to carbon cycling in per sample was built using the RStudio v 3.5.1 (R Core Team, Auckland, NZL) software package with “gplot” and “pheatmap”. Soil microbial community composition across samples was performed using Bray-Curtis distance metrics and visualized via nonmetric multidimensional scaling (NMDS). The linkages between soil characteristics and the relative abundance of genes related to metabolism of macro-molecular compounds corresponded the SOC chemical functional groups based on Pearson correlation analysis were built using RStudio v 3.5.1 (R Core Team, Auckland, NZL) software package with “psych” and “corrplot”. The effects of these soil characteristics on the functional genes were assessed via CCA (Canonical Correlation Analysis), which was performed via Canoco for Windows 4.5 (Biometris-Plant Research international, Wageningen, NL). The linkages between soil microbial composition and SOC chemical functional groups were evaluated using redundancy analysis (RDA), which was performed via Canoco for Windows 4.5 (Biometris-Plant Research international, Wageningen, NL). The related network of |rho| >0.8 and p value <0.01 was constructed and imported into Gephi software (version 0.9.2, WebAtlas, Paris, FR) for visualization, and Gephi is available at http://gephi.org.

3. Results

3.1. Soil Chemical Characteristics under Different Revegetation Types

Significant differences were observed among different revegetation types in terms of contents of soil total C (F = 111.797, p = 0.0001), DOC (F = 3.648, p = 0.0441), MBC (F = 462.166, p = 0.0001), and total N (F = 112.275, p = 0.0001) (Table 1). Interestingly, total C, DOC, total N, and MBC were highest in JM, with 100.53 g·kg−1, 171.80 mg·kg−1, 7.80 g·kg−1, and 53.35 mg·kg−1, respectively, followed by QM, while the PK presented only 41.70 g/kg, 3.58 g/kg, 123.45 mg/kg, and 14.26 mg/kg, respectively. Suggesting that broadleaf forests are conducive to increase the soil total C, DOC, total N, and MBC contents, compared to coniferous forests. The ratios of soil C/N across all soil samples were below 25:1, ranging between 11.36 with 13.81. Soil pH value ranged from 4.89 to 5.70, with the lowest in the QM, and the highest in the JM (Table 1). Statistically significant variations of total P (F = 26.59, p < 0.001), and available N (F = 14.99, p < 0.001) also were found under different revegetation types. The contents of NH4+-N, NO3-N significantly differed among different revegetation types (F = 14.955, p = 0.0003; F = 15.595, p = 0.0003).

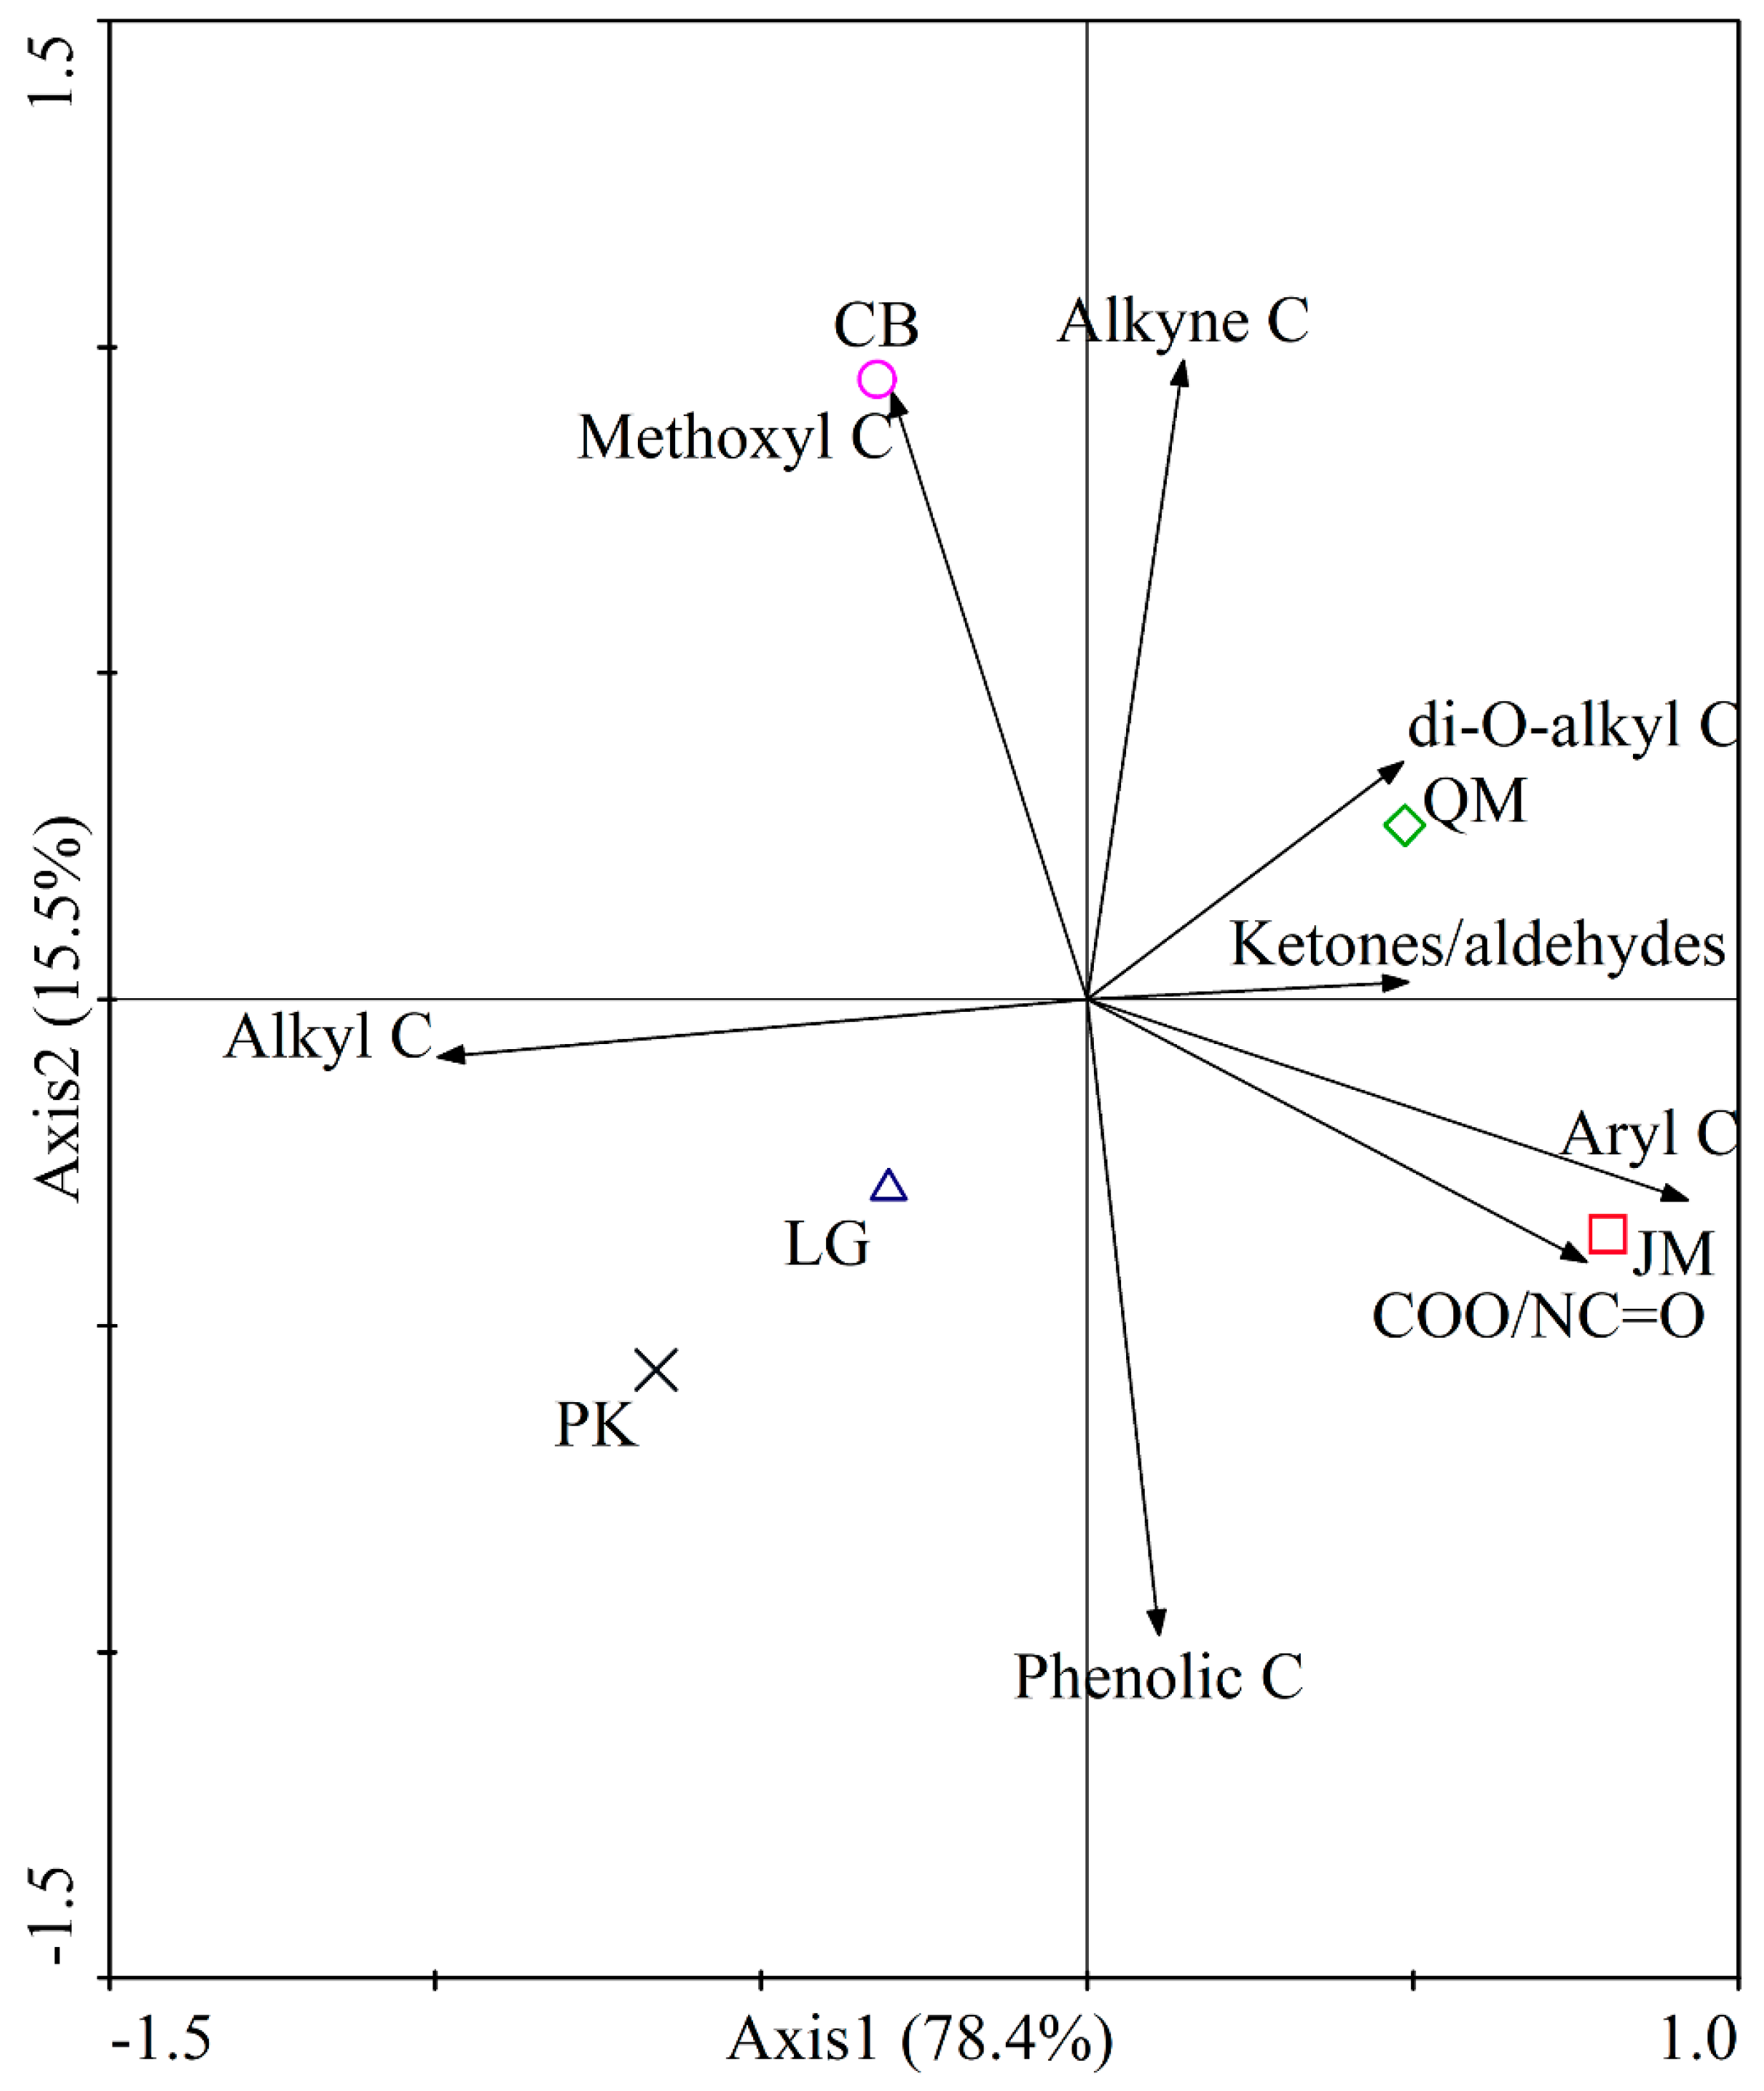
3.2. SOC Chemical Composition under Different Revegetation Types

In our study, 4 obvious resonance areas and corresponding organic C fractions, including alkyl C, O-alkyl C, aromatic C, and carbonyl C, were obtained by the SOC solid-state 13C NMR spectrogram (Figure 2). The solid-state 13C NMR spectrogram of SOC under different revegetation types demonstrated that the resonance peak of alkyl C occurred at 33 ppm. Meanwhile, the intense signals of methoxyl C, alkyne C, and di-O-alkyl C occurred at 55 ppm, 72 ppm, and 105 ppm. With regard to the aromatic C, the aryl C and phenolic C peaks occurred at 130 ppm and 152 ppm, respectively. Finally, the carbonyl C peak occurred at 173 ppm (Figure 2).
The ratios of different SOC chemical functional groups to total SOC were shown in Table 2. Overall, the O-alkyl C was the dominant C form among the different functional groups under different revegetation types, accounting for 46.34%, 47.63%, 46.62%, 45.36%, and 48.12% of total SOC at the JM, QM, LG, PK, and CB, respectively, followed by alkyl C (17.14%–21.84%), aromatic C (17.34%–20.69%), and carbonyl C (13.61%–15.82%). The O-alkyl content was 45.15% under PK site, significantly lower than others, while, the content of alkyl C presented highest in the PK with 21.84%, significantly higher than others. No statistically significant differences of the carbonyl C content were observed among different revegetation types (Table 2). The relative content of aromatic C in JM and QM were 20.69%, and 20.25%, respectively, and significantly higher than others. At all five sites, the alkyl C/O-alkyl C ratio was highest under the PK, presenting 0.48, followed by LG and CB, with 0.44, and 0.42, respectively, lowest in QM and JM, with 0.33, and 0.34, respectively. The aromaticity of JM and QM were 0.25, and 0.24, respectively, significantly higher than others, while, the aliphaticity of JM and QM were smaller than others, with 0.75, and 0.76, respectively. CB had the highest ratio of aliphatic C to aromatic C, presenting 3.97, while, the ratios of aromatic C to O-alkyl C was smallest with 0.36 (Table 3).
PCA plot based on the functional groups relative abundance across different revegetation types showed that the first two axes accounted for 93.9% (PCA1 78.4% and PCA2 15.5%) of the total variance. The plot showed that the JM and QM were separated from LG, PK and CB, especially along PCA1. Also, the investigated SOC chemical composition were distinctly separated in the quadrants (Figure 3). The ketones/aldehydes, alkyne C, and di-O-alkyl C were located in the first quadrant, methoxyl C in the second quadrant, alkyl C in the third quadrant, and other components were situated in the fourth quadrant, including phenolic C, COO/NC=O, and aryl C (Figure 3). The heatmap based on the abundances of different SOC chemical functional groups elucidated that the SOC chemical functional groups under different revegetation types could be divided into three groups, including JM plus QM, CB, and PK plus LG (Figure 4).

3.3. Soil Microbial Community Characteristics under Different Revegetation Types

A total of four kingdoms were observed via whole metagenome shotgun sequencing, including eight archaea, 55 bacteria, 15 eukaryota, and two viruses, giving a total 80 phyla. At the level of phylum, the relative abundance of the major phyla were Proteobacteria (71.45% to 73.92%), Actinobacteria (8.01% to 9.96%), Acidobacteria (3.30% to 4.51%), Planctomycetes (0.71% to 0.84%), Gemmatimonadetes (0.53% to 0.89%), Verrucomicrobia (0.59% to 0.82%), Firmicutes (0.60% to 0.73%), Nitrospirae (0.33% to 0.97%), Bacteroidetes (0.51% to 0.68%), Cyanobacteria (0.22% to 0.28%), Chloroflexi (0.19% to 0.23%), Deinococcus-Thermus (0.18% to 0.24%), Euryarchaeota (0.13% to 0.17%), Ascomycota(0.09% to 0.12%), Chlorobi (0.06% to 0.08%), Thaumarchaeota (0.03% to 0.10%), Basidiomycota (0.03% to 0.05%), and Armatimonadetes (0.03% to 0.04%), accounting for 91.09% (Figure 5A). Additionally, the NMDS plot based on the Bray–Curtis distances for the microbial species among different samples indicated that the phylogenetic distance of soil microorganism increased with different forests from broadleaf forest to coniferous forests, with similar distances in LG and PK, QM, and JM (Figure 5B). In this article, the microbial community composition was determined via whole metagenome shotgun based on Illumina HiSeq, including soil bacteria, soil fungi, soil archaea, and viruses. However, in the article of “Different revegetation types alter soil physical-chemical characteristics and fungal community in the Baishilazi Nature Reserve” published in PeerJ, we only study the soil fungal communities which were assessed employing internally transcribed spacer (ITS) rRNA Illunima Miseq high-throughput sequencing.

3.4. Functional Characteristics of Soil Microbial Communities

The soil metagenomics reads were annotated using the Kyoto Encyclopedia of Genes and Genomes Database (KEGG) database to compare the carbon cycles functional genes relative abundances under different revegetation types. A total of 7343 KO genes were obtained in all metagenomes. Variations of functional gene families among the different revegetation types were investigated via PCA (Figure 6), which showed distinct differences of functional genes between coniferous forests (LG, and PK) and broadleaf forests (JM and QM). In our study, we detected 828 carbon cycle genes, including 91 genes of carbon fixation, 46 genes of methane metabolism, and 692 genes of carbohydrate metabolism, and the relative abundances of the genes involved in carbon fixation, methane metabolism, and carbohydrate metabolism are shown in Table S5. Heatmaps of the C cycles based on KEGG database showed clear difference among different forests, especially between broadleaf forests (JM and QM) and coniferous forests (LG, and PK) (Figure 7).
In our study, we detected seven corresponding macro-molecular compounds of different organic carbon functional group, and 244 genes related to metabolism across all samples (Table S1, Table 4). The relative abundance of genes about cutin, suberine and wax, cellulose, hemi-cellulose, amino acids, amino sugars, ketone, and aldehyde metabolism across five different revegetation types ranged from 0.03% to 0.07%, 22.51% to 26.63%, 2.37% to 3.17%, 0.03% to 0.04%, 1.15% to 1.27%, 0.29% to 0.33%, 2.70% to 3.03% (Table 4). Interestingly, the results of heatmap based on the relative abundance of genes corresponding macro-molecular compounds metabolism of different SOC chemical functional groups showed consistence with the pattern of SOC chemical composition. The related to genes relative abundance also divided into three groups, including JM plus QM, LG plus PK, and CB (Figure 8). The dominant genes across different samples were bglX, malZ, bglB, xylA, celF, gmuG, atoB, ALDH (Aldehyde Dehydrogenase (NAD+)), hemL, ACMSD (Aminocarboxymuconate-semialdehyde Decarboxylase), and glmS, the average relative abundance accounting for 9.59%, 6.05%, 3.23%, 2.25%, 0.57%, 0.50%, 0.21%, 0.17%, 0.12%, 0.12%, and 0.11% (Table S2). Heatmap analysis based on the relative abundance of the top 50 genes related to corresponding macro-molecular compounds metabolism of different SOC chemical functional groups showed that the genes relative abundances across all samples were also divided into three groups, including JM plus QM, LG plus PK, and CB (Figure 9).

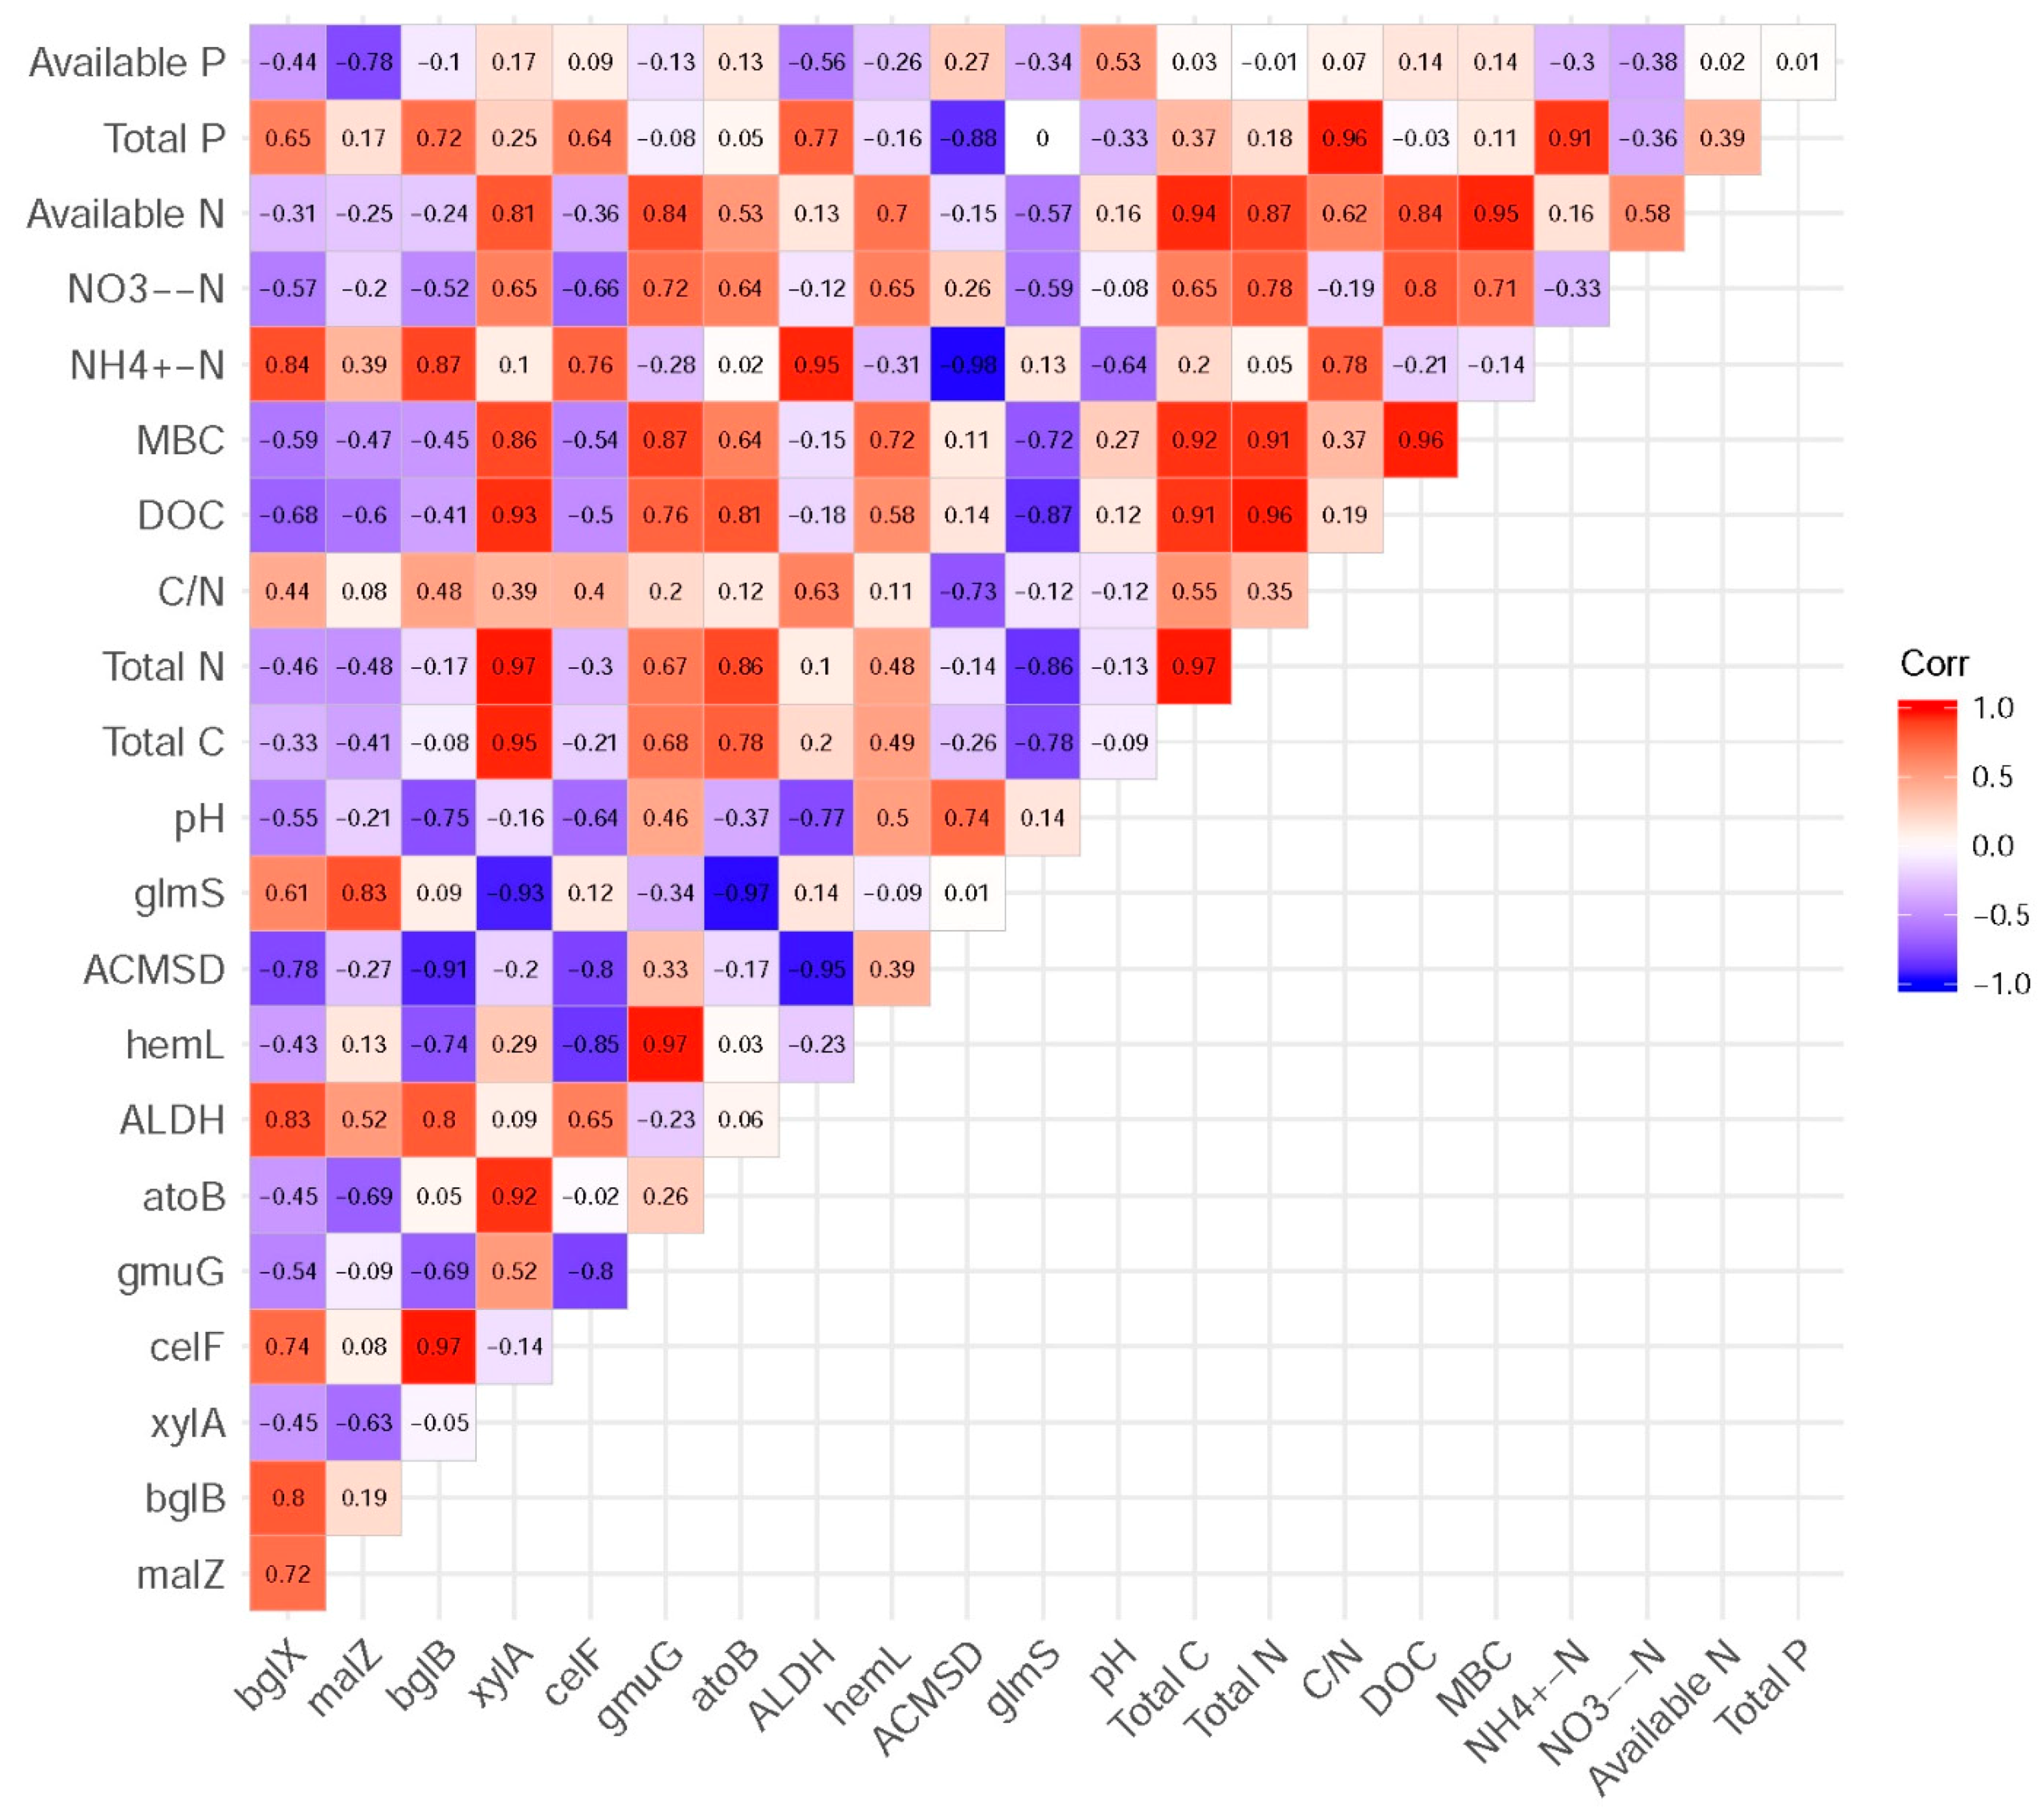
3.5. Functional Genes and Their Relationship with Measured Soil Characteristics

The correlations between the genes related to corresponding macro-molecular compounds metabolism of different SOC chemical functional groups (>0.1%) and soil characteristics were explored using Pearson’s correlation analyses. The xylA relative abundance existed significantly positive correlation with the contents of total C (r = 0.95, p < 0.05), total N (r = 0.97, p < 0.01), and DOC (r = 0.93, p < 0.05) contents. The NH4+-N content had dramaticly positive relation to ALDH (r = 0.95, p < 0.05), while, significantly negative correlation with ACMSD (r = −0.98, p < 0.01) (Figure 10). The effects of these soil characteristics on the functional genes were assessed via CCA (Canonical Correlation Analysis) (Figure 11), which demonstrated that these soil variables accounted for 96.4% of the variation in the functional genes, with the CCA1 explaining 68.6% and the CCA2 27.8%. Moreover, CCA plot clearly revealed that the concentration of soil total C (r = 0.79), DOC (r = 0.96), total N (r = 0.87), and MBC(r = 0.88) were the most significant contributors to the variation in gene related to corresponding macro-molecular compounds metabolism of different SOC chemical functional groups, and these arrows’ directions were strongly correlated with the CCA1. Soil total C, total N, and DOC were likely to have played important roles in shaping the composition of genes as important variables are represented by longer arrows (Figure 11).

3.6. Correlations between Microbial Community and SOC Chemical Functional Groups

As shown in the redundancy analysis (RDA), the soil microbial community composition showed significant correlations with SOC chemical functional groups (Figure 12). The results illuminated that the cumulative interpretation variations of the first and second axes were 92.9%, indicating that SOC chemical functional groups greatly influenced the soil microbial community composition. The contents of alkyl C (r = −0.719), methoxyl C (r = −0.711), COO/NC=O (r = 0.985), and Ketones/aldehydes (r = 0.720) were significantly related with axis 1, with the first axial interpretation rate of 53.4%. The alkyne C (r = 0.895), and phenolic C (r = −0.858) content were observably correlated with axis 2.
The overall relationships between SOC chemical structure and soil microbial community composition were determined by Network analysis (Figure 13). The network was characterized by 68 significant associations (edges) of 26 nodes, with modularity index of 1.38, characteristic path length of 2.91, and average clustering coefficient of 0.63. Alkyne C showed negative correlation, while phenolic C showed positive correlation with Bacteroidetes, Chloroflexi, and Euryarchaeota. Meanwhile, alkyne C also had negative association with Deinococcus-Thermus, and Thaumarchaeota. Methoxyl C presented negative association, however, COO/NC=O showed positive association with Gemmatimonadetes, and Nitrospirae. Verrucomicrobia had negative association with alkyl C, and positive association with aryl C. COO/NC=O showed a negative relation with Proteobacteria, and methoxyl C presented negative relation with Euryarchaeota.

4. Discussion

4.1. Soil Characteristics Response to Different Revegetation Types

In our study, it is found that soil pH under QM was most acidity, which might be correlated with the quality of litter. The previous research from Gao et al. [56] reported that the QM litter leaf quality is low, with lower nitrogen content, higher lignin content, higher C/N ratio, and higher lignin/N, and these are the main factors leading to the lowest pH value under QM. Our findings was agreement with the research of Rahimabady et al. [57], suggesting that broadleaf forests (JM, QM) were conducive to increase the contents of soil total C, DOC, total N, and MBC. Interestingly, soil total C, DOC, and total N contents in LG were higher than those of PK, which might be attributed to different litter quality and quantity [58], and root exudates [59] of different tree species. LG, which is a cold temperate deciduous coniferous forest, can produce a higher litter amount, while, PK is often a component of warm evergreen coniferous forests with relatively little litter [60]. Thus, the forest types, especially between coniferous forest and broadleaf forest, would seem to play a vital role in regulating soil characteristics inside the same soil climate.

4.2. The Effect of Different Revegetation Types on SOC Chemical Composition

In our research, solid-state 13C CPMAS NMR was used to investigate the responses of SOC chemical composition to different revegetation types. In the four zones of 13C NMR spectrum, the distribution of the relative signal intensity showed a similar trend, as previous studies has already been reported [61,62,63]. Significant differences of SOC fractions were observed among different revegetation types, which was agreement with previous studies [15]. In our study, O-alkyl C dominated the SOC under different revegetation types, which was consistent with the findings from a natural Hinoki cypress forest in Taiwan [64], chestnut plantation soils in subtropical China [65], and the forest patterns change from conifer-broadleaf forests to plantation forests [66]. However, the results from Ussiri and Johnson showed that the alkyl C was the predominated SOC in Bh horizon of a hardwood forest soil [67]. The functional group of O-alkyl C mainly represents carbohydrates in the fresh plant material [68], including hemicellulose, cellulose, and methoxyl-C, which has strong activity and they are relatively easy to decompose. Thus, our data suggested that carbohydrates might be the most important organic compound in SOC. In our study, the O-alkyl C was the highest in the CB, and previous study reported that higher ratios of O-alkyl C confirmed that the study soil was successfully fertilized due to an accumulation of labile organic carbon. In contrast, alkyl C is generally believed to derive from original microbial metabolites products and plant biopolymers such as cork and keratin [69], both representing difficult to degrade and relatively stable organic C [70]. Alkyl carbon is easy to be adsorbed on powder and clay components, and has strong anti-decomposition ability. The accumulation of alkyl C components in soil can effectively promote the formation of stable carbon pools in soil [71]. In our study, PK had the highest alkyl C contents and the lowest O-alkyl content (Table 2), suggesting that soil organic carbon has high stability the stability under PK. The different proportion of O-alkyl C under different revegetation types could be attributed to the different litter and root residues in soil [72]. The structure and chemical properties of soil organic carbonization significantly affect the decomposition rate.
Additionally, we applied several indices to evaluate the extent of SOC decomposition, including alkyl C/O-alkyl C, aliphatic C/aromatic C, aromatic C/O-alkyl C, and aromaticity [73,74]. The ratio of alkyl C/O-alkyl C reflects the degree of alkylation of the SOC, which has been used as an index to indicate the SOC decomposition or humification degree [62] and the stability of SOC. A higher value of this ratio indicates that the higher the SOC decomposition degree [75], the smaller the decomposition potential [76], the better the stability of SOC [77]. In our study, the alkyl C in PK and LG significantly higher than in JM and QM, and the ratio of alkyl C/O-alkyl C in PK and LG significantly higher than JM and QM. Both of them indicated that the SOC in LG and PK showed higher stability than JM and QM. Our results were consistent with the research from Wang et al. [78] who reported that the SOC stability in coniferous forests is better than that in broadleaf forests, mainly because there are more waxy and keratinous components in coniferous forest litter, which increases the refractory alkyl carbon.

4.3. Responses of Soil Microbial Functional Genes Involved in Carbon Cycling under Different Revegetation Types

Soil microorganisms play vital roles in organic carbon turnover and fixation [79]. A previous study reported that in current carbon degradation models microbial biomass is a very important parameter [80], while, the microbial biomass alone cannot accurately predict the decomposition process. The influences of soil microbial community composition on soil organic decomposition is getting more and more attention [81,82]. Studies have shown that the soil microbial community structure can not only regulate the change of soil carbon pool, but also determine the change trend of soil carbon pool [83,84]. The findings of our research, which included deep sequencing of the soil metagenome under different revegetation types, provide a large dataset, and the screening of KEGG databases as a basis for determining the microbial potential functions. The microbial community composition and gene families differed significantly under different revegetation types, because changes of microbial community function are often correlated with variations of community composition [85,86].
Soil carbon cycling is one of the most important and complex metabolic processes in biogeochemical cycle [87]. The findings revealed that the functional genes abundance in soil microbial community predicted the activity of carbon degrading enzyme [88]. In our study, KEGG databases was used to illustrate the differences of genes related carbon cycle, which contains genes and enzymes involved in carbohydrate metabolism, C fixation [89]. In our study, we detected functional genes involved in carbon metabolism processes such as carbon fixation, carbon degradation, and methane cycle genes involved in soil microbes, all of them under different revegetation types were divided into three groups, containing JM plus QM, LG plus PK, and CB. Studies on key carbon metabolism genes involved in the corresponding macro-molecular compounds of different organic carbon functional group were different abundances. In our study, the results showed that microbial functions involved carbon cycles based on KEGG databases were significantly related with the soil properties, such soil total C, DOC, and total N contents, which was similar to the previous researches [90]. Degens et al. [91] found that the variation range microbial catabolism was correlated with the variation range of SOC. Soil microbes cause changes in soil organic carbon components by participating in the decomposition of SOC [92]. The correlation might be that the soil provides a substrate for plant and microorganisms growth, and the plant affects the microbial community through the input of organic matter [93].
In our study, we did find that different revegetation types altered soil characteristics, SOC chemical composition, soil microbial community composition, and functional genes. However, as a potential downside of the experimental design that three plots were collected in each revegetation type does not constitute independent replication. So, the differences we found between "revegetation type" could potentially instead be due to some other factors. As a consequence, more reasonable sampling design could further inform our understanding of the effect of different revegetation types on soil carbon and microorganisms.

4.4. Response of Soil C Fractions to Soil Microbial Composition under Different Revegetation Types

Interestingly, in our study, the heatmap and NMDS plots for the relative abundances of different SOC chemical functional groups, the phylogenetic distance for microbes, the C cycles based on KEGG database, and the relative abundance of genes corresponding macro-molecular compounds metabolism of different SOC chemical functional groups under different revegetation types all could be divided into three groups, including JM plus QM, PK plus LG, and CB, showing that changes of SOC chemical functional groups are related to changes of the soil microbial community composition and the functional genes. In our study, it is found that SOC chemical functional groups were related to soil microbial community, which was consistent with previous studies [94,95,96]. The significant associations between the contents of alkyne C, phenolic C, pethoxyl C, COO/NC=O, and alkyl C with soil microbial composition partially supports our first hypothesis. The quantity and the chemical structure of soil organic C is closely related to the activity [97] and composition of microbial populations [98,99]. This research is a step further from previous studies that only reported relationships between fungal community composition and recalcitrant SOM (Soil Organic Matter) [28]. The research results provided strong scientific provide scientific basis for revealing the stabilization mechanism of soil organic carbon under different revegetation types.

5. Conclusions

Different revegetation types altered soil characteristics, SOC chemical composition, soil microbial community composition, and functional genes. Moreover, we demonstrated that changes of the microbial community composition and the SOC chemical functional groups were closely linked. The alkyne C, phenolic C, methoxyl C, COO/NC=O, and alkyl C were strong related to the composition of soil microbial community and their contents explained a major portion of the variation in total microbial composition. We also conclude that the relative abundances of different SOC chemical functional groups, and the phylogenetic distance for microbes under different revegetation types could be divided into three groups, including JM plus QM, CB, and PK plus LG. Moreover, the C cycles based on KEGG database, and the relative abundance of genes corresponding macro-molecular compounds metabolism of different SOC chemical functional groups under different revegetation types also showed consistency, suggesting that variations in SOC chemical structure were strongly associated with shifts in soil microbial community taxa and functional genes which, in turn, may be affected by changes in soil properties, such as soil total C, total N, and DOC.

Supplementary Materials

The following are available online at https://www.mdpi.com/1999-4907/10/3/240/s1, Table S1: Basic information of sequencing, Table S2: High throughput sequencing results, Table S3: High throughput sequencing results, Table S4: High throughput sequencing results, Table S5: Selected genes related to C cycling and their abundances at different revegetation types.

Author Contributions

Data curation: J.D.; formal analysis: Y.Y. and W.Z.; funding acquisition: W.Z. and Y.Z.; project administration: W.Z. and Y.Z.; software: J.D. and Y.Y.; visualization: Y.Y.; writing—original draft: J.D. and Y.Z.; writing—review and editing: W.Z.

Funding

This research was financially supported by the National Science and Technology Support Program of China (2015BAD07B30103), the special fund for forestry scientific research in the public interest (no. 201404303-05), the Sub-project of the National Key Research and Development Program (2017YFC050410501), the Special Fund for Forest Scientific Research in the Public Welfare (201304216), and Cfern and Beijing Techno Solutions Award Funds on Excellent Academic Achievements.

Acknowledgments

This work is guided on “Observation Methodology for Long-term Forest Ecosystem Research” of the National Standards of the People’s Republic of China (GB/T 33027-2016).

Conflicts of Interest

The authors declare no conflict of interest.

References

  1. Liu, X.; Herbert, S.; Hashemi, A.M.; Zhang, X.; Ding, G.W. Effects of agricultural management on soil organic matter and carbon transformation—A review. Plant Soil Environ. 2006, 52, 531–543. [Google Scholar] [CrossRef]
  2. Solomon, D.; Lehmann, J.; Thies, J.; Schäfer, T.; Liang, B.; James, K.; Neves, E.G.; Petersen, J.; Luizao, F.; Skjemstad, J. Molecular signature and sources of biochemical recalcitrance of organic C in Amazonian Dark Earths. Geochim. Cosmochim. Acta 2007, 71, 2290–2298. [Google Scholar] [CrossRef]
  3. Jiménez-González, M.A.; Álvarez, A.M.; Hernández, Z.; Almendros, G. Soil carbon storage predicted from the diversity of pyrolytic alkanes. Biol. Fert. Soils 2018, 54, 617–629. [Google Scholar] [CrossRef]
  4. Banning, N.C.; Grant, C.D.; Jones, D.L.; Murphy, D.V. Recovery of soil organic matter, organic matter turnover and nitrogen cycling in a post-mining forest rehabilitation chronosequence. Soil Biol. Biochem. 2008, 40, 2021–2031. [Google Scholar] [CrossRef]
  5. Carvalhais, N.; Forkel, M.; Khomik, M.; Bellarby, J.; Jung, M.; Migliavacca, M.; Mu, M.; Saatchi, S.; Santoro, M.; Thurner, M.; et al. Global covariation of carbon turnover times with climate in terrestrial ecosystems. Nature 2014, 514, 213–217. [Google Scholar] [CrossRef]
  6. Paquette, A.; Messier, C. The role of plantations in managing the world’s forests in the Anthropocene. Front. Ecol. Environ. 2010, 8, 27–34. [Google Scholar] [CrossRef]
  7. Liu, B.J.; Lu, F.; Wang, X.K.; Liu, W.W.; Wang, L.Y.; Rao, E.; Zhang, L.; Zheng, H. Greenhouse gas emissions and net carbon sequestration of the natural forest protection program in China. Acta Ecol. Sin. 2016, 36, 4266–4278. [Google Scholar]
  8. Lal, R. Soil carbon sequestration impacts on global climate change and food security. Science 2004, 304, 1623–1627. [Google Scholar] [CrossRef]
  9. Shrestha, B.M.; Certini, G.; Forte, C.; Singh, B.R. Soil organic matter quality under different land uses in a mountain watershed of Nepal. Soil Sci. Soc. Am. J. 2008, 72, 1563–1569. [Google Scholar] [CrossRef]
  10. Tuo, D.; Gao, G.; Chang, R.; Li, Z.; Ma, Y.; Wang, S.; Wang, C.; Fu, B. Effects of revegetation and precipitation gradient on soil carbon and nitrogen variations in deep profiles on the Loess Plateau of China. Sci. Total Environ. 2018, 626, 399–411. [Google Scholar] [CrossRef]
  11. Schulp, C.J.E.; Nabuurs, G.J.; Verburg, P.H.; de Waal, R.W. Effect of tree species on carbon stocks in forest floor and mineral soil and implications for soil carbon inventories. For. Ecol. Manag. 2008, 256, 482–490. [Google Scholar] [CrossRef]
  12. Fekete, I.; Lajtha, K.; Kotroczó, Z.; Várbíró, G.; Varga, C.; Tóth, J.A.; Demeter, I.; Veperdi, G.; Berki, I. Long-term effects of climate change on carbon storage and tree species composition in a dry deciduous forest. Glob. Chang. Biol. 2017, 23, 3154–3168. [Google Scholar] [CrossRef]
  13. Lajtha, K.; Bowden, R.D.; Crow, S.; Fekete, I.; Kotroczó, Z.; Plante, A.F.; Simpson, M.; Nadelhoffer, K.J. The Detrital Input and Removal Treatment (DIRT) Network. Sci. Total Environ. 2017, 640–641, 1112–1120. [Google Scholar]
  14. Liu, S.; Bondlamberty, B.; Boysen, L.R.; Ford, J.D.; Fox, A.; Gallo, K.; Hatfield, J.; Henebry, G.M.; Huntington, T.G.; Liu, Z.; et al. Grand challenges in understanding the interplay of climate and land changes. Earth Interact. 2017, 21, 1–43. [Google Scholar] [CrossRef]
  15. Huang, Z.; Xu, Z.; Chen, C.; Boyd, S. Changes in soil carbon during the establishment of a hardwood plantation in subtropical Australia. For. Ecol. Manag. 2008, 254, 46–55. [Google Scholar] [CrossRef] [Green Version]
  16. Song, B.; Luo, M.; Li, H.; He, S. Chemical composition and structural features of soil organic carbon (SOC) in plantation. J. Southwest Minzu Univ. 2017, 43, 474–479. [Google Scholar]
  17. Fan, F.; Li, Z.; Wakelin, S.A.; Steven, W.; Yu, W.; Liang, Y.C. Mineral fertilizer alters cellulolytic community structure and suppresses soil cellobiohydrolase activity in a long-term fertilization experiment. Soil Biol. Biochem. 2012, 55, 70–77. [Google Scholar] [CrossRef]
  18. Schmidt, M.W.; Torn, M.S.; Abiven, S.; Dittmar, T.; Guggenberger, G.; Janssens, I.A.; Kleber, M.; Kögel-Knabner, I.; Lehmann, J.; Manning, D.A.; et al. Persistence of soil organic matter as an ecosystem property. Nature 2011, 478, 49–56. [Google Scholar] [CrossRef] [Green Version]
  19. Gavazov, K.S. Dynamics of alpine plant litter decomposition in a changing climate. Plant Soil 2010, 337, 19–32. [Google Scholar] [CrossRef]
  20. Djukic, I.; Kepfer-Rojas, S.; Schmidt, I.K.; Larsen, K.S.; Beier, C.; Berg, B.; Verheyen, K. Early stage litter decomposition across biomes. Sci. Total Environ. 2018, 628–629, 1369–1394. [Google Scholar] [CrossRef]
  21. Schimel, J.P.; Schaeffer, S.M. Microbial control over carbon cycling in soil. Front. Microbiol. 2012, 3, 348. [Google Scholar] [CrossRef]
  22. Heimann, M.; Reichstein, M. Terrestrial ecosystem carbon dynamics and climate feedbacks. Nature 2008, 451, 289–292. [Google Scholar] [CrossRef] [Green Version]
  23. Harris, J. Soil microbial communities and restoration ecology: Facilitators or Followers? Science 2009, 325, 573–574. [Google Scholar] [CrossRef]
  24. Palomo, A.; Jane Fowler, S.; Gülay, A.; Rasmussen, S.; Sicheritz-Ponten, T.; Smets, B.F. Metagenomic analysis of rapid gravity sand filter microbial communities suggests novel physiology of Nitrospira spp. ISME J. 2016, 10, 2569–2581. [Google Scholar] [CrossRef]
  25. Kuramae, E.E.; Gamper, H.A.; Yergeau, E.; Piceno, Y.M.; Brodie, E.L.; Desantis, T.Z.; Andersen, G.L.; van Veen, J.A.; Kowalchuk, G.A. Microbial secondary succession in a chronosequence of chalk grasslands. ISME J. 2010, 4, 711–715. [Google Scholar] [CrossRef] [Green Version]
  26. Mao, J.; OLK, D.C.; Fang, X.W.; He, Z.Q.; Schmidt-Rohr, K. Influence of animal manure application on the chemical structures of soil organic matter as investigated by advanced solid-state NMR and FT-IR spectroscopy. Geoderma 2008, 146, 353–362. [Google Scholar] [CrossRef]
  27. Stursová, M.; Zifčáková, L.; Leigh, M.B.; Burgess, R.; Baldrian, P. Cellulose utilization in forest litter and soil: Identification of bacterial and fungal decomposers. FEMS Microbiol. Ecol. 2012, 80, 735–746. [Google Scholar] [CrossRef]
  28. Prescott, C.E.; Grayston, S.J. Tree species influence on microbial communities in litter and soil: Current knowledge and research needs. For. Ecol. Manag. 2013, 309, 19–27. [Google Scholar] [CrossRef]
  29. Urbanová, M.; Šnajdr, J.; Baldrian, P. Composition of fungal and bacterial communities in forest litter and soil is largely determined by dominant trees. Soil Biol. Biochem. 2015, 84, 53–64. [Google Scholar] [CrossRef]
  30. Ding, J.; Zhang, Y.; Wang, M.; Sun, X.; Cong, J.; Deng, Y.; Lu, H.; Yuan, T.; van Nostrand, J.D.; Li, D.; et al. Soil organic matter quantity and quality shape microbial community compositions of subtropical broadleaved forests. Mol. Ecol. 2015, 24, 5175–5185. [Google Scholar] [CrossRef] [Green Version]
  31. Tian, J.; Mccormack, M.L.; Wang, J.Y.; Guo, D.; Wang, Q.F.; Zhang, X.Y.; Yu, G.; Blagodatskaya, E.; Kuzyakov, Y. Linkages between the soil organic matter fractions and the microbial metabolic functional diversity within a broad-leaved Koreanpine forest. Eur. J. Soil Biol. 2015, 66, 57–64. [Google Scholar] [CrossRef]
  32. Li, Y.; Li, Y.; Chang, S.X.; Liang, X.; Qin, H.; Chen, J.H.; Xu, Q.F. Linking soil fungal community structure and function to soil organic carbon chemical composition in intensively managed subtropical bamboo forests. Soil Biol. Biochem. 2017, 107, 19–31. [Google Scholar] [CrossRef]
  33. Zhao, F.Z.; Ren, C.J.; Zhang, L.; Han, X.H.; Yang, G.H.; Wang, J. Changes in soil microbial community are linked to soil carbon fractions after afforestation: Soil microbial community affects carbon fractions. Eur. J. Soil Biol. 2018, 69, 370–379. [Google Scholar] [CrossRef]
  34. Qi, J.H. Content of soil organic carbon and its relations with physicochemical properties of secondary natural Oak forests in eastern mountain Area of Liaoning Province. J. Soil Water Conserv. 2017, 31, 135–140. [Google Scholar]
  35. Yin, Y.; Liu, Y.Y.; Jing, Y.L.; Wei, Y.W.; An, Y.Q.; Yan, P.C.; Zhou, Y.B. Contents of soil organic carbon and components in three types of forests in the mountain area of Eastern Liaoning. Chin. J. Ecol. 2018, 37, 2100–2106. [Google Scholar]
  36. Deng, J.; Yin, Y.; Zhu, W.; Zhou, Y. Variations in soil bacterial community diversity and structures among different revegetation types in the Baishilazi Nature Reserve. Front. Microbiol. 2018, 9, 2874. [Google Scholar] [CrossRef]
  37. Deng, J.; Yin, Y.; Luo, J.; Zhu, W.; Zhou, Y. Different revegetation types alter soil physical-chemical characteristics and fungal community in the Baishilazi Nature Reserve. PeerJ 2019, 6, e6251. [Google Scholar] [CrossRef]
  38. Zhang, M.; Liu, L.; Yi, L.T. Plant floristic diversity in the Baishilazi National Nature Reserve of Liaoning, China. J. Zhejiang A F Univ. 2014, 31, 210–216. [Google Scholar]
  39. Zhang, H.; You, W.; Wei, W.; Zhou, M. Soil physical and chemical properties and correlation with organic carbon in original Korean pine forest in Eastern Liaoning mountainous area. J. Northwest A F Univ. 2017, 45, 76–82. [Google Scholar]
  40. Ren, C.; Zhao, F.; Kang, D.; Yang, G.; Han, X.H.; Tong, X.; Feng, Y.; Ren, G. Linkages of C:N:P stoichiometry and bacterial community in soil following afforestation of former farmland. Forest Ecol. Manag. 2016, 376, 59–66. [Google Scholar] [CrossRef]
  41. Schrumpf, M.; Schulze, E.D.; Kaiser, K.; Schumacher, J. How accurately can soil organic carbon stocks and stock changes be quantified by soil inventories? Biogeosciences 2011, 8, 1193–1212. [Google Scholar] [CrossRef]
  42. Jackson, M.L. Soil chemical analysis. Verlag: Prentice Hall, Inc. Englewood Cliffs, NJ. 498 S. DM 39.40. J. Soil Sci. Plant Nutr. 1958, 85, 251–252. [Google Scholar]
  43. Qing, W.; Cong, W.; Yu, W.; Turak, A.; Chen, D.; Huang, Y.; Ao, J.; Jiang, Y.; Huang, Z. Effects of nitrogen and phosphorus inputs on soil bacterial abundance, diversity, and community composition in Chinese Fir plantations. Front. Microbiol. 2018, 9, 1543. [Google Scholar]
  44. Cai, Z.Q.; Zhang, Y.H.; Yang, C.; Wang, S. Land-use type strongly shapes community composition, but not always diversity of soil microbes in tropical China. Catena 2018, 165, 369–380. [Google Scholar] [CrossRef]
  45. Gong, W.; Yan, X.Y.; Wang, J.Y.; Hu, T.X.; Gong, Y.B. Long-term manuring and fertilization effects on soil organic carbon pools under a wheat–maize cropping system in North China Plain. Plant Soil 2009, 314, 67–76. [Google Scholar] [CrossRef]
  46. Bao, S.D. Soil and Agricultural Chemistry Analysis; China Agriculture Press: Beijing, China, 2000. (In Chinese) [Google Scholar]
  47. Brookes, P.C. Chloroform fumigation and the release of soil nitrogen: A rapid direct extraction method to measure microbial biomass nitrogen in soil. Soil Biol. Biochem. 1985, 17, 837–842. [Google Scholar] [CrossRef]
  48. Schmidt, M.W.I. Improvement of 13C and 15N CPMAS NMR spectra of bulk soils, particle size fractions and organic material by treatment with 10% hydrofluoric acid. Eur. J. Soil Biol. 2010, 48, 319–328. [Google Scholar] [CrossRef]
  49. MAO, J.D.; Hu, W.G.; Schmidt-Rohr, K.; Davies, G.; Ghabbour, E.A.; Xing, B.S. Quantitative characterization of humic substances by solid-state carbon-13 nuclear magnetic resonance. Soil Sci. Soc. Am. J. 2000, 64, 873–884. [Google Scholar] [CrossRef]
  50. Li, H.; Durbin, R. Fast and accurate short read alignment with Burrows-Wheeler transform. Bioinformatics 2009, 25, 1754–1760. [Google Scholar] [CrossRef] [Green Version]
  51. Peng, Y.; Leung, H.C.; Yiu, S.M.; Chin, F.Y. IDBA-UD: A de novo assembler for single-cell and metagenomic sequencing data with highly uneven depth. Bioinformatics 2012, 28, 1420–1428. [Google Scholar] [CrossRef]
  52. Zhu, W.; Lomsadze, A.; Borodovsky, M. Ab initio gene identification in metagenomic sequences. Nucleic Acids Res. 2010, 38, e132. [Google Scholar] [CrossRef]
  53. Fu, L.; Niu, B.; Zhu, Z.; Wu, S.; Li, W. CD-HIT: Accelerated for clustering the next-generation sequencing data. Bioinformatics 2012, 28, 3150–3152. [Google Scholar] [CrossRef]
  54. Buchfink, B.; Xie, C.; Huson, D.H. Fast and sensitive protein alignment using DIAMOND. Nat. Methods 2015, 12, 59–60. [Google Scholar] [CrossRef]
  55. Banerjee, S. Network analysis reveals functional redundancy and keystone taxa amongst bacterial and fungal communities during organic matter decomposition in an arable soil. Soil Biol. Biochem. 2016, 97, 188–198. [Google Scholar] [CrossRef]
  56. Gao, Q.; Yang, Z.L. Diversity and distribution patterns of root-associated fungi on herbaceous plants in alpine meadows of southwestern China. Mycologia 2016, 108, 281–291. [Google Scholar] [CrossRef]
  57. Rahimabady, M.S.; Akbarinia, M.; Kooch, Y. The effect of land covers on soil quality properties in the Hyrcanian regions of Iran. J. Biosci. Bioeng. 2015, 4, 73–79. [Google Scholar]
  58. Jahed, R.R.; Hosseini, S.M. The effect of natural and planted forest stands on soil fertility in the Hyrcanian region, Iran. Biodiver. J. Biol. Diver. 2014, 15, 206–214. [Google Scholar] [CrossRef]
  59. Grayston, S.J.; Prescott, C.E. Microbial communities in forest floors under four tree species in coastal British Columbia. Soil Biol. Biochem. 2005, 37, 1157–1167. [Google Scholar] [CrossRef]
  60. Yang, X.Q.; Han, Y.Z. Spatial variations of soil organic carbon and nitrogen of forest land in Guandi Mountain. For. Res. 2001, 24, 223–229. [Google Scholar]
  61. Pérez, M.G.; Martin-Neto, L.; Saab, S.C.; Novotny, E.; Pereira Milori, D.M.B.; Bagnato, V.S.; Colnago, L.A.; Melo, W.J.; Knicker, H. Characterization of humic acids from a Brazilian Oxisol under different tillage systems by EPR, 13C NMR, FTIR and fluorescence spectroscopy. Geoderma 2004, 118, 181–190. [Google Scholar] [CrossRef]
  62. Zhao, H.; Lv, Y.; Wang, X.; Zhang, H.; Yang, X. Tillage impacts on the fractions and compositions of soil organic carbon. Geoderma 2012, 189–190, 397–403. [Google Scholar] [CrossRef]
  63. Rumpel, C.; KögelKnabner, I.; Bruhn, F. Vertical distribution, age, and chemical composition of organic carbon in two forest soils of different pedogenesis. Org. Geochem. 2002, 33, 1131–1142. [Google Scholar] [CrossRef]
  64. Li, Y.F.; Zhang, J.; Chang, S.X.; Jiang, P.K.; Zhou, G.; Shen, Z.; Wu, J.; Lin, L.; Wang, Z.; Shen, M.C. Converting native shrub forests to Chinese chestnut plantations and subsequent intensive management affected soil C and N pools. For. Ecol. Manag. 2014, 312, 161–169. [Google Scholar] [CrossRef]
  65. Chung, T.L.; Chen, J.S.; Chiu, C.Y.; Tian, G.L. 13C-NMR spectroscopy studies of humic substances in subtropical perhumid montane forest soil. J. For. Res. 2012, 17, 458–467. [Google Scholar] [CrossRef]
  66. Fang, X.; Zhang, J.; Meng, M.; Guo, X.; Wu, Y.; Liu, X.; Zhao, K.; Ding, L.; Shao, Y.; Fu, W. Forest-type shift and subsequent intensive management affected soil organic carbon and microbial community in southeastern China. Eur. J. For. Res. 2017, 136, 689–697. [Google Scholar] [CrossRef]
  67. Ussiri, D.A.N.; Johnson, C.E. Organic matter composition and dynamics in a northern hardwood forest ecosystem 15 years after clear-cutting. For. Ecol. Manag. 2007, 240, 131–142. [Google Scholar] [CrossRef]
  68. Solomon, D.; Lehmann, J.; Kinyangi, J.; Amelung, W.; Lone, I.; Pell, A.N.; Riha, S.; Ngoze, S.; Verchot, L.; Mbugua, D.; et al. Long-term impacts of anthropogenic perturbations on dynamics and speciation of organic carbon in tropical forest and subtropical grassland ecosystems. Glob. Chang. Biol. 2010, 13, 511–530. [Google Scholar] [CrossRef]
  69. Ussiri, D.A.N.; Johnson, C.E. Characterization of organic matter in a northern hardwood forest soil by 13 C NMR spectroscopy and chemical methods. Geoderma 2003, 111, 123–149. [Google Scholar] [CrossRef]
  70. Bonanomi, G.; Incerti, G.; Giannino, F.; Mingo, A.; Lanzotti, V.; Mazzoleni, S. Litter quality assessed by solid state 13C NMR spectroscopy predicts decay rate better than C/N and Lignin/N ratios. Soil Biol. Biochem. 2013, 56, 40–48. [Google Scholar] [CrossRef]
  71. Lorenz, K.; Lal, R.; Jiménez, J.J. Soil organic carbon stabilization in dry tropical forests of Costa Rica. Geoderma 2009, 152, 95–103. [Google Scholar] [CrossRef]
  72. Li, Z.; Zhao, B.; Wang, Q.; Cao, X.; Zhang, J. Differences in chemical composition of soil organic carbon resulting from long-term fertilization strategies. PLoS ONE 2015, 10, e0124359. [Google Scholar] [CrossRef]
  73. Helfrich, M.; Ludwig, B.; Buurman, P.; Flessa, H. Effect of land use on the composition of soil organic matter in density and aggregate fractions as revealed by solid-state 13C NMR spectroscopy. Geoderma 2006, 136, 331–341. [Google Scholar] [CrossRef]
  74. Dieckow, J.; Bayer, C.; Conceição, P.C.; Zanatta, J.A.; Martin-Neto, L.; Milori, D.B.M.; Salton, J.C.; Macedo, M.M.; Mielniczuk, J.; Hernani, L.C. Land use, tillage, texture and organic matter stock and composition in tropical and subtropical Brazilian soils. Eur. J. Soil Biol. 2010, 60, 240–249. [Google Scholar] [CrossRef]
  75. Webster, E.A.; Hopkins, D.W.; Chudek, J.A.; Haslam, S.F.; Simek, M.; Pîcek, T. The relationship between microbial carbon and the resource quality of soil carbon. J. Environ. Qual. 2001, 30, 147–150. [Google Scholar] [CrossRef]
  76. Yan, H.; Chen, C.; Xu, Z.; Williams, D.; Xu, J.M. Assessing management impacts on soil organic matter quality in subtropical Australian forests using physical and chemical fractionation as well as 13C NMR spectroscopy. Soil Biol. Biochem. 2009, 41, 640–650. [Google Scholar]
  77. Dou, S.; Zhang, J.J.; Li, K. Effect of organic matter applications on 13C-NMR spectra of humic acids of soil. Eur. J. Soil Biol. 2010, 59, 532–539. [Google Scholar] [CrossRef]
  78. Wang, H.; Liu, S.R.; Mo, J.M.; Wang, J.X.; Makeschin, F.; Wolff, M. Soil organic carbon stock and chemical composition in four plantations of indigenous tree species in subtropical China. Ecol. Res. 2010, 25, 1071–1079. [Google Scholar] [CrossRef]
  79. Liang, C.; Balser, T.C. Warming and nitrogen deposition lessen microbial residue contribution to soil carbon pool. Nat. Commun. 2012, 3, 1222. [Google Scholar] [CrossRef] [Green Version]
  80. Manzoni, S.; Porporato, A. Soil carbon and nitrogen mineralization: Theory and models across scales. Soil Biol. Biochem. 2009, 41, 1355–1379. [Google Scholar] [CrossRef]
  81. Strickland, M.S.; Lauber, C.; Fierer, N.; Bradford, M.A. Testing the functional significance of microbial community composition. Ecology 2009, 90, 441–451. [Google Scholar] [CrossRef]
  82. Sergey, B.; Evgenia, B.; Tatyana, Y.; Yakov, K. Model of apparent and real priming effects: Linking microbial activity with soil organic matter decomposition. Soil Biol. Biochem. 2010, 42, 1275–1283. [Google Scholar]
  83. Carney, K.M.; Hungate, B.A.; Drake, B.G.; Megonigal, J.P. Altered soil microbial community at elevated CO(2) leads to loss of soil carbon. Proc. Natl. Acad. Sci. USA 2007, 104, 4990–4995. [Google Scholar] [CrossRef]
  84. Billings, S.A.; Ziegler, S.E. Altered patterns of soil carbon substrate usage and heterotrophic respiration in a pine forest with elevated CO2 and N fertilization. Glob. Chang. Biol. 2008, 14, 1025–1036. [Google Scholar] [CrossRef]
  85. Fierer, N. Embracing the unknown: Disentangling the complexities of the soil microbiome. Nat. Rev. Microbiol. 2017, 15, 579–590. [Google Scholar] [CrossRef]
  86. Salles, J.F.; Poly, F.; Schmid, B.; Le Roux, X. Community niche predicts the functioning of denitrifying bacterial assemblages. Ecology 2009, 90, 3324–3332. [Google Scholar] [CrossRef] [Green Version]
  87. Rui, J.; Li, J.; Wang, S.; An, J.; Liu, W.T.; Lin, Q.; Yang, Y.; He, Z.; Li, X. Responses of bacterial communities to simulated climate changes in alpine meadow soil of the Qinghai-Tibet plateau. Appl. Environ. Microbiol. 2015, 81, 6070–6077. [Google Scholar] [CrossRef]
  88. Trivedi, P. Microbial regulation of the soil carbon cycle: Evidence from gene|[ndash]|enzyme relationships. ISME J. 2016, 10, 2593–2604. [Google Scholar] [CrossRef]
  89. Kanehisa, M.; Araki, M.; Goto, S.; Hattori, M.; Hirakawa, M.; Itoh, M.; Katayama, T.; Kawashima, S.; Okuda, S.; Tokimatsu, T.; et al. KEGG for linking genomes to life and the environment. Nucleic Acids Res. 2008, 36, 480–484. [Google Scholar] [CrossRef]
  90. Zhong, Y.; Yan, W.; Wang, R.; Wang, W.; Shangguan, Z.P. Decreased occurrence of carbon cycle functions in microbial communities along with long-term secondary succession. Soil Biol. Biochem. 2018, 123, 207–217. [Google Scholar] [CrossRef]
  91. Degens, B.P.; Schipper, L.A.; Sparling, G.P.; Vojvodic-Vukovic, M. Decreases in organic C reserves in soils can reduce the catabolic diversity of soil microbial communities. Soil Biol. Biochem. 2000, 32, 189–196. [Google Scholar] [CrossRef]
  92. Tardy, V.; Spor, E.; Mathieu, O.; Eque, J.L.E.; Terrat, S.; Plassart, P.; Regnier, T.; Bardgett, P.; van Der Putten, W.H.; Roggero, P.P.; et al. Shifts in microbial diversity through land use intensity as drivers of carbon mineralization in soil. Soil Biol. Biochem. 2015, 90, 204–213. [Google Scholar] [CrossRef]
  93. Cleveland, C.C.; Reed, S.C.; Keller, A.B.; Nemergut, D.R.; O’Neill, S.P.; Ostertag, R.; Vitousek, P.M. Litter quality versus soil microbial community controls over decomposition: A quantitative analysis. Oecologia 2014, 174, 283–294. [Google Scholar] [CrossRef]
  94. Xiao, Y.; Huang, Z.G.; Lu, X.G. Changes of soil labile organic carbon fractions and their relation to soil microbial characteristics in four typical wetlands of Sanjiang Plain, Northeast China. Ecol. Eng. 2015, 82, 381–389. [Google Scholar] [CrossRef]
  95. Ren, C.; Sun, P.; Kang, D.; Zhao, F.; Feng, Y.; Ren, G.; Han, X.; Yang, G. Responsiveness of soil nitrogen fractions and bacterial communities to afforestation in the Loess Hilly Region (LHR) of China. Sci. Rep. 2016, 6, 28469. [Google Scholar] [CrossRef] [Green Version]
  96. Chen, Z.; Wang, H.; Liu, X.; Zhao, X.; Lu, D.; Zhou, J.; Li, C. Changes in soil microbial community and organic carbon fractions under short-term straw return in a rice-wheat cropping system. Soil Till. Res. 2017, 165, 121–127. [Google Scholar] [CrossRef]
  97. Cusack, D.F.; Silver, W.L.; Torn, M.S.; Burton, S.D.; Firestone, M.K. Changes in microbial community characteristics and soil organic matter with nitrogen additions in two tropical forests. Ecology 2011, 92, 621–632. [Google Scholar] [CrossRef]
  98. Ng, E.L.; Patti, A.F.; Rose, M.T.; Schefe, C.; Wilkinson, K.; Smernik, R.J.; Smernik, T.R. Does the chemical nature of soil carbon drive the structure and functioning of soil microbial communities? Soil Biol. Biochem. 2014, 70, 54–61. [Google Scholar] [CrossRef] [Green Version]
  99. Wang, H.; Liu, S.; Scott, C.; Wang, J.; Shi, Z.; Huang, X.; Wen, Y.; Lu, L.; Cai, D.X. Soil microbial community composition rather than litter quality is linked with soil organic carbon chemical composition in plantations in subtropical China. J. Soil Sediment 2015, 15, 1094–1103. [Google Scholar] [CrossRef]
Figure 1. Map showing sampling location of the study.
Forests 10 00240 g001
Figure 2. Solid-state 13C NMR spectrogram of SOC. Carbonyl C (0–45 ppm); O-alkyl C (45–110 ppm), aromatic C (110–160 ppm) and carbonyl C (160–220 ppm). LG: Larix gmelinii Rupr.; PK: Pinus koraiensis Sieb.; CB: Conifer-broadleaf forest; JM: Juglans mandshurica Maxim.; QM: Quercus mongolica Fisch.
Forests 10 00240 g002
Figure 3. A principal component analyses (PCA) combined ordination plot performed on relative abundance of 7 C functional groups across different revegetation types. JM: Juglans mandshurica; QM: Quercus mongolica; CB: Conifer-broadleaf forest; LG: Larix gmelinii; PK: Pinus koraiensis.
Forests 10 00240 g003
Figure 4. Heatmap and hierarchical cluster analysis based on the relative abundance of the soil organic carbon chemical functional groups. JM: Juglans mandshurica; QM: Quercus mongolica; CB: Conifer-broadleaf forest; LG: Larix gmelinii; PK: Pinus koraiensis.
Forests 10 00240 g004
Figure 5. Comparison of microbial communities in soils under five different revegetation types. The relative abundance of the dominant bacterial phyla (A). A two-dimensional sample sequencing diagram of nonmetric multidimensional scaling (NMDS) based on the analysis of Bray-Curtis distance (B). LG: Larix gmelinii; PK: Pinus koraiensis; CB: Conifer-broadleaf forest; JM: Juglans mandshurica; QM: Quercus mongolica.
Forests 10 00240 g005
Figure 6. PCA plot of functional gene families based on KEGG database. LG: Larix gmelinii; PK: Pinus koraiensis; CB: Conifer-broadleaf forest; JM: Juglans mandshurica; QM: Quercus mongolica.
Forests 10 00240 g006
Figure 7. Heatmaps of the C cycles pathways based on KEGG database for different revegetation types. A: Carbon fixation; B: Methane metabolism; C: carbohydrate metabolism. LG: Larix gmelinii; PK: Pinus koraiensis; CB: Conifer-broadleaf forest; JM: Juglans mandshurica; QM: Quercus mongolica.
Forests 10 00240 g007
Figure 8. Heatmap analysis based on the relative abundance of corresponding macro-molecular compounds metabolism of different organic carbon functional group. LG: Larix gmelinii; PK: Pinus koraiensis; CB: Conifer-broadleaf forest; JM: Juglans mandshurica; QM: Quercus mongolica.
Forests 10 00240 g008
Figure 9. Heatmap and hierarchical cluster analysis based on the relative abundance of the top 50 genes corresponding macro-molecular compounds metabolism of different organic carbon functional group. LG: Larix gmelinii; PK: Pinus koraiensis; CB: Conifer-broadleaf forest; JM: Juglans mandshurica; QM: Quercus mongolica.
Forests 10 00240 g009
Figure 10. Gene abundance of carbon cycling and their relationship with measured chemical characteristics.
Forests 10 00240 g010
Figure 11. Canonical correspondence analysis (CCA) revealing the effects of soil characteristics on genes related to carbon cycling.
Forests 10 00240 g011
Figure 12. Redundancy analysis (RDA) illustrating the effects of SOC chemical functional groups on soil microbial community composition.
Forests 10 00240 g012
Figure 13. Network analysis demonstrating the relationships between microbial community composition and SOC chemical functional groups. Red lines represent strong positive linear (r > 0.8), and green lines represent strong negative linear (r < −0.8) relationships.
Forests 10 00240 g013
Table 1. Soil chemical characteristics of different revegetation types.
TypesJMQMCBLGPKFp Value
pH5.70a4.89c4.99c5.40b5.48b111.7970.0001
Total C (g·kg−1)100.53a84.62b75.49c43.79d41.70d112.2750.0001
Total N (g·kg−1)7.80a7.38a5.47b3.85c3.58c29.7180.0001
C/N12.89ab11.64bc13.81a11.36c11.65bc6.4890.0077
Dissolved organic carbon (DOC) (mg·kg−1)171.80a158.71ab130.31b123.82b123.45b3.6480.0441
Microbial biomass carbon (MBC) (mg·kg−1)53.35a33.11b23.96c17.91d14.26e462.1660.0001
NH4+-N (mg·kg−1)4.63b11.84b42.74a5.12b4.43b14.9550.0003
NO3-N (mg·kg−1)13.17ab14.35a7.78c10.94b6.24c15.5950.0003
Available N (mg·kg−1)57.15a41.25b43.60b33.35c28.04c14.99p < 0.001
Total P (g·kg−1)0.93b0.74bc1.46a0.62c0.77bc26.59p < 0.001
Available P (mg·kg−1)4.42ab2.39ab2.53ab1.21b5.65a1.99p = 0.172
Note: LG: Larix gmelinii Rupr.; PK: Pinus koraiensis Sieb.; CB: Conifer-broadleaf forest; JM: Juglans mandshurica Maxim.; QM: Quercus mongolica Fisch.. Results of F test and p value from the ANOVAs are included. Different letters in the same line (a, b, c) indicate a significant difference at p < 0.05.
Table 2. Relative percent (%) of different SOC chemical functional groups from soil samples (0–10 cm depth) under different revegetation types.
Alkyl CO-alkyl CAromatic CCarbonyl C
0–45 Alkyl C45–60 Methoxyl C60–93 Alkyne C93–110 di-O-alkyl CTotal110–142 Aryl C142–160 Phenolic CTotal160–190 COO/NC=O190–220 Ketones/AldehydesTotal
JM17.14 ± 0.69cC9.26 ± 0.41aA28.53 ± 0.86bBC8.55 ± 0.58abA46.34 ± 1.72abAB14.45 ± 1.00aA6.24 ± 0.14aAB20.69 ± 1.13aA13.60 ± 0.99aA2.22 ± 1.22aA15.82 ± 2.19aA
QM18.15 ± 1.49bcBC9.41 ± 0.21aA29.59 ± 0.23aAB8.62 ± 0.22abA47.63 ± 0.43aAB14.26 ± 0.99abA5.99 ± 0.45abAB20.25 ± 1.43abA12.74 ± 0.59aA1.23 ± 0.13abA13.97 ± 0.71aA
LG20.62 ± 1.04aAB9.36 ± 0.31aA28.49 ± 0.16bBC8.77 ± 0.05aA46.62 ± 0.38abAB12.86 ± 0.08bcAB6.28 ± 0.08aA19.14 ± 0.06abcAB12.64 ± 0.80aA0.97 ± 0.59bA13.61 ± 1.39aA
PK21.84 ± 1.26aA9.31 ± 0.19aA28.12 ± 0.76bC7.93 ± 0.51bA45.36 ± 1.43bB12.38 ± 0.31cAB6.27 ± 0.22aAB18.65 ± 0.52bcAB12.70 ± 0.27aA1.45 ± 0.43abA14.15 ± 0.69aA
CB20.29 ± 1.62abABC9.51 ± 0.05aA30.08 ± 0.22aA8.53 ± 0.45abA48.12 ± 0.45aA11.87 ± 1.07cB5.47 ± 0.46bB17.34 ± 1.53cB12.57 ± 0.32aA1.69 ± 0.18abA14.26 ± 0.48aA
Note: LG: Larix gmelinii; PK: Pinus koraiensis; CB: Conifer-broadleaf forest; JM: Juglans mandshurica; QM: Quercus mongolica. Different letters in the same line (a, b, c) indicate a significant difference at p < 0.05; Different letters in the same line (A, B, C) indicate a significant difference at p < 0.01.
Table 3. Ratios of different SOC chemical functional groups under five different revegetation types.
SamplesAlkyl C/O-alkyl CAromaticityAliphatic/AromaticAromatic C /O-alkyl CAliphaticity
JM0.37 ± 0.02cB0.25 ± 0.01aA3.07 ± 0.18cB0.45 ± 0.02aA0.75 ± 0.01cB
QM0.38 ± 0.03cB0.24 ± 0.02abA3.26 ± 0.27bcB0.43 ± 0.03aA0.76 ± 0.02bcB
LG0.44 ± 0.02abAB0.22 ± 0.00bcAB3.51 ± 0.08bcAB0.41 ± 0.00aAB0.78 ± 0.00abAB
PK0.48 ± 0.04aA0.22 ± 0.01bcAB3.61 ± 0.12abAB0.41 ± 0.01aAB0.78 ± 0.01abAB
CB0.42 ± 0.04bcAB0.20 ± 0.02cB3.97 ± 0.43aA0.36 ± 0.03bB0.80 ± 0.02aA
Note: LG: Larix gmelinii; PK: Pinus koraiensis; CB: Conifer-broadleaf forest; JM: Juglans mandshurica; QM: Quercus mongolica. Aromaticity = aromatic C/(alkyl C + aromatic C + O-alkyl C); aliphatic/aromatic = (O-alkyl C + alkyl C)/aromatic C; aliphaticity = (O-alkyl C + alkyl C)/(alkyl C + aromatic C + O-alkyl C). Different letters in the same line (a, b, c) indicate a significant difference at p < 0.05; Different letters in the same line (A, B, C) indicate a significant difference at p < 0.01.
Table 4. The relative abundance of genes corresponding macro-molecular compounds metabolism of different soil organic carbon chemical functional groups.
TypesCutin, Suberine and Wax BiosynthesisCelluloseHemi-CelluloseAmino AcidsAmino SugarsKetoneAldehyde
QM0.03%23.49%3.04%0.03%1.15%0.33%2.88%
CB0.07%26.63%2.73%0.03%1.18%0.31%3.03%
PK0.06%23.65%2.45%0.04%1.24%0.30%2.70%
LG0.09%24.81%2.37%0.04%1.27%0.29%2.78%
JM0.03%22.51%3.17%0.03%1.18%0.31%2.79%
Note: LG: Larix gmelinii; PK: Pinus koraiensis; CB: Conifer-broadleaf forest; JM: Juglans mandshurica; QM: Quercus mongolica.

