Article

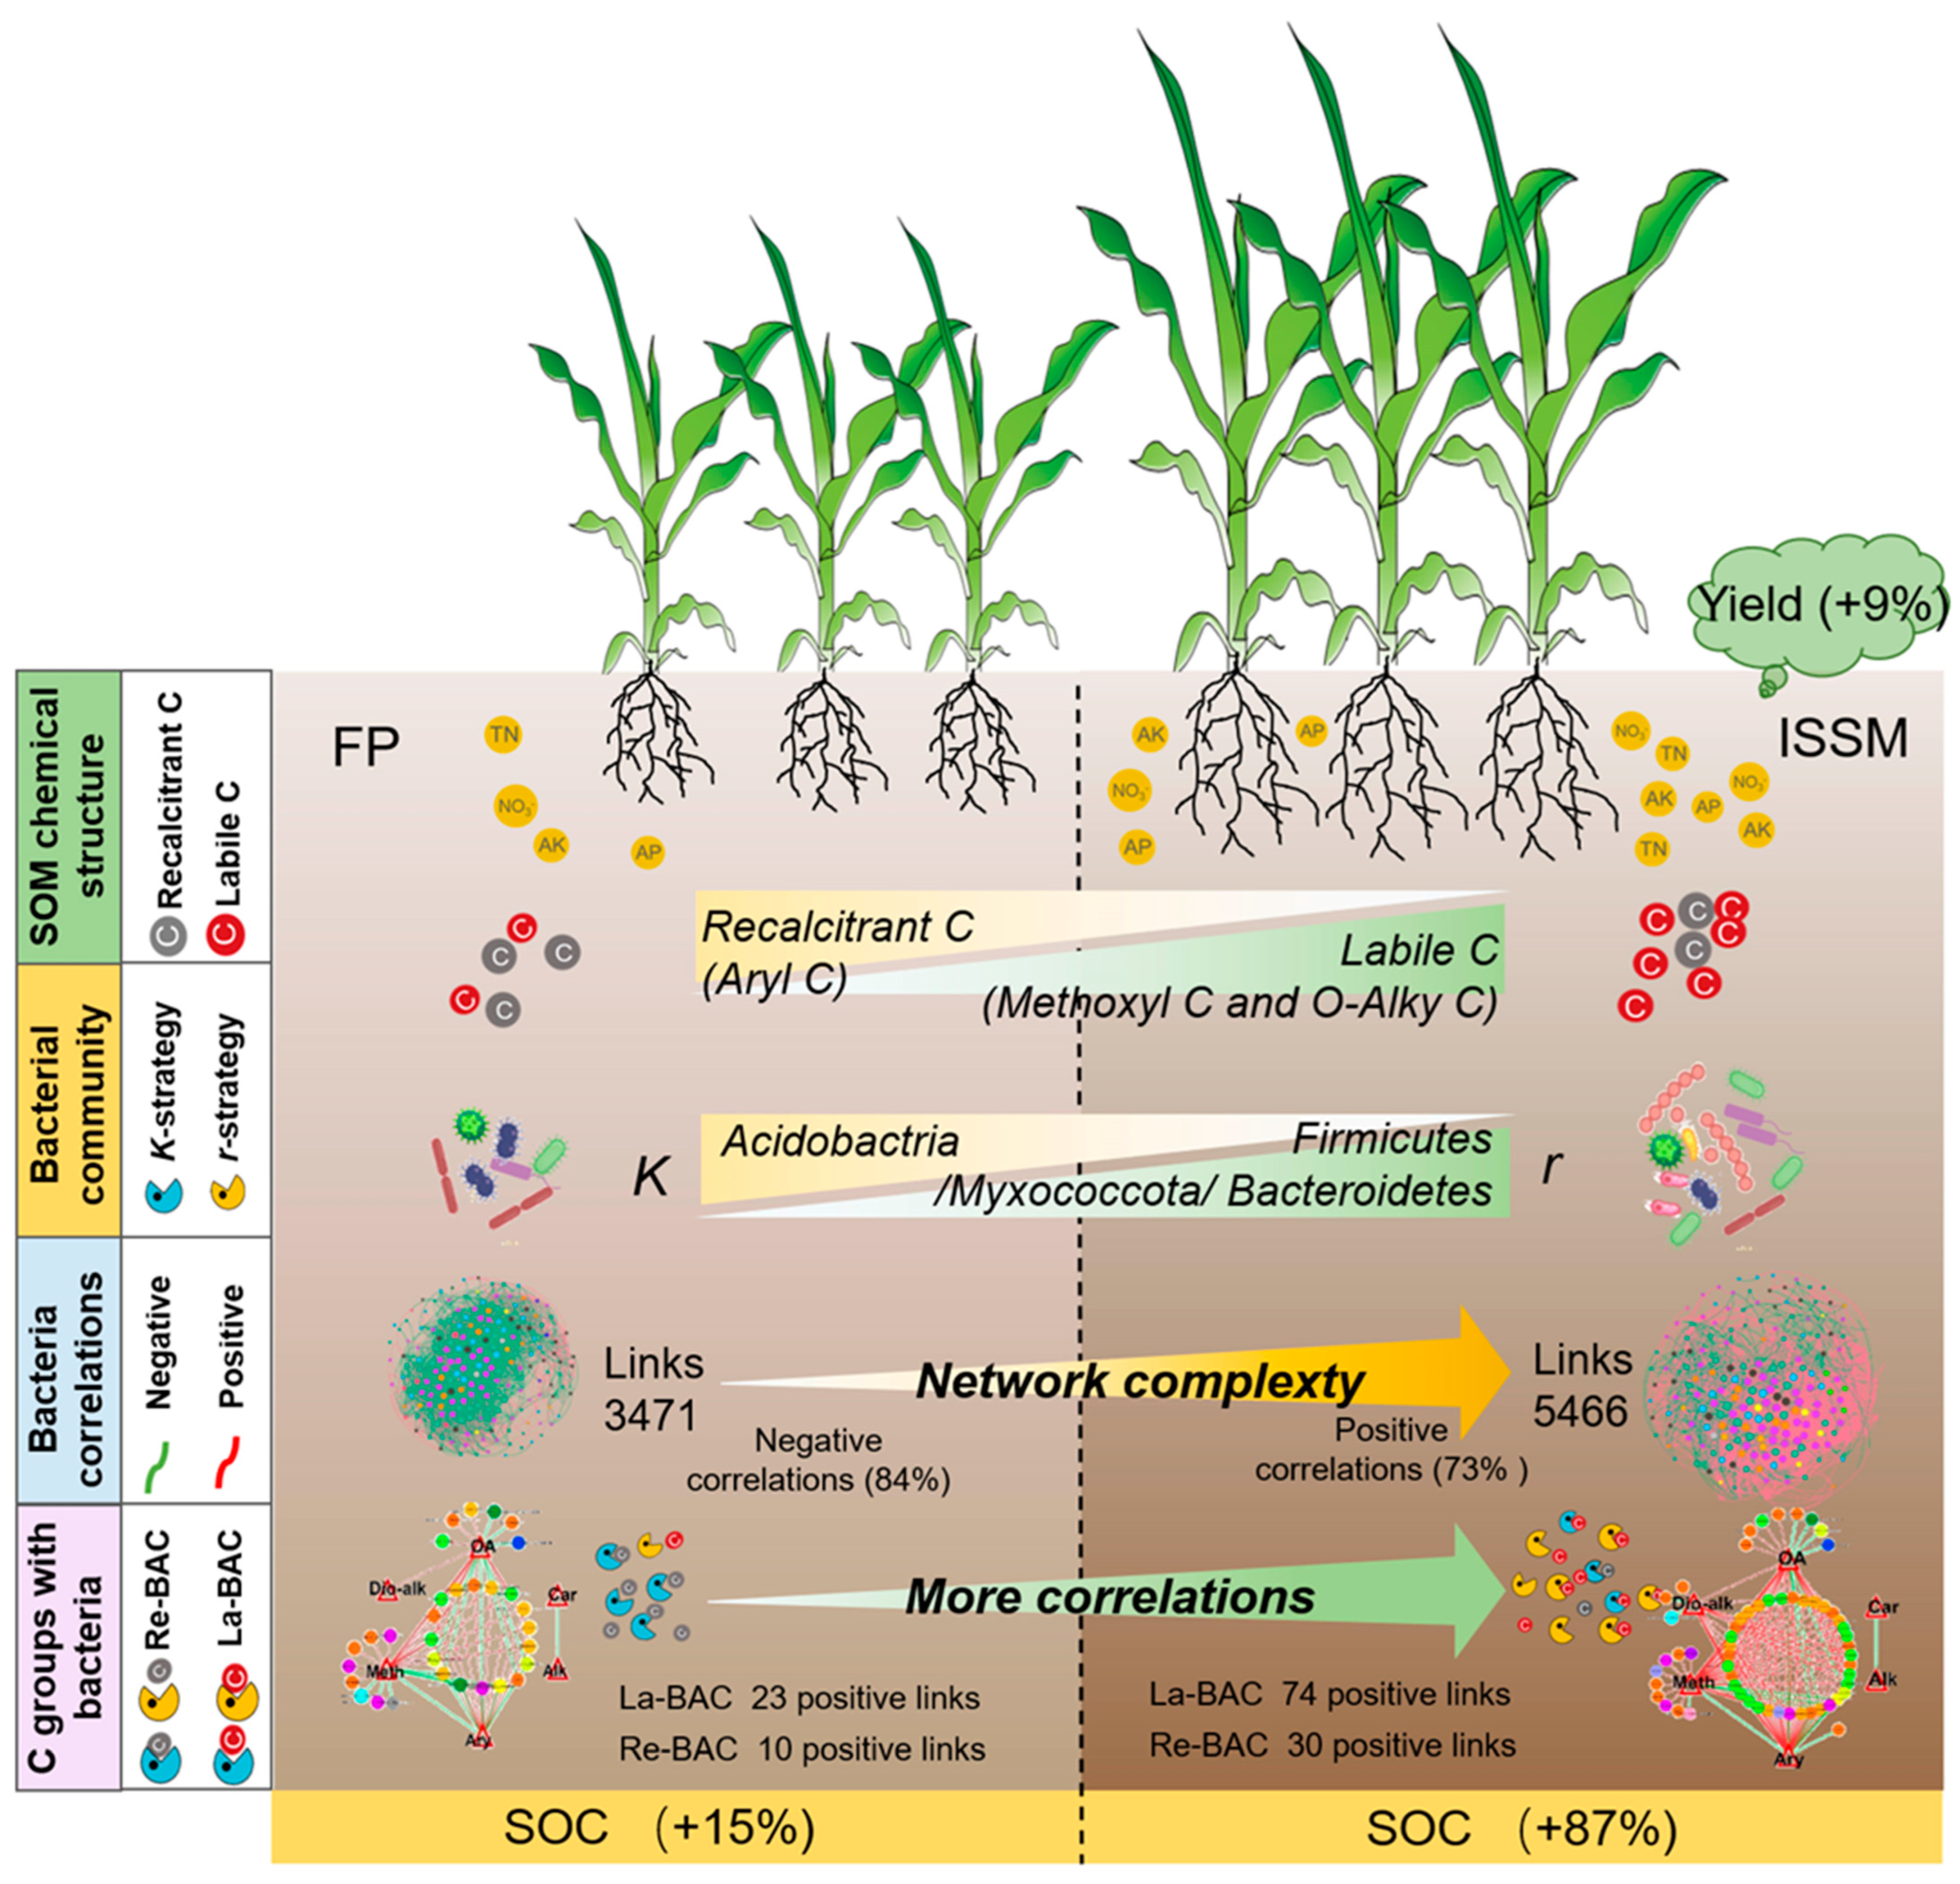
Altered Organic Matter Chemical Functional Groups and Bacterial Community Composition Promote Crop Yield under Integrated Soil–Crop Management System

1
College of Resources and Environment, Jilin Agricultural University, Changchun 130118, China
2
College of Resources and Environmental Sciences, Key Laboratory of Plant-Soil Interactions, Ministry of Education, National Academy of Agriculture Green Development, China Agricultural University, Beijing 100193, China
3
Biology Department, College of Science, United Arab Emirates University, Al Ain P.O. Box 15551, United Arab Emirates
4
Institute of Crop Sciences, Chinese Academy of Agricultural Sciences/Key Laboratory of Crop Physiology and Ecology, Ministry of Agriculture and Rural Affairs of China, Beijing 100081, China
5
Department of Soil Science of Temperate Ecosystems, University of Göttingen, 37077 Göttingen, Germany
*
Author to whom correspondence should be addressed.
Agriculture 2023, 13(1), 134; https://doi.org/10.3390/agriculture13010134
Submission received: 18 November 2022 / Revised: 30 December 2022 / Accepted: 31 December 2022 / Published: 4 January 2023
(This article belongs to the Special Issue Soil Carbon and Microbial Processes in Agriculture Ecosystem)

Abstract

:
Sustainable agricultural production is essential to ensure an adequate food supply, and optimal farm management is critical to improve soil quality and the sustainability of agroecosystems. Integrated soil–crop management based on crop models and nutrient management designs has proven useful in increasing yields. However, studies on its effects on the chemical composition of soil organic carbon (SOC) and microbial community composition, as well as their linkage with crop yield, are lacking. Here, we investigated the changes in SOC content, its chemical functional groups, and bacterial communities, as well as their association with crop yield under different farmland management based on four farmland management field trials over 12 years (i.e., FP: farmer practice; IP: improved farmer practice; HY: high-yield system; and ISSM: integrated soil–crop system management). The crop yield increased by 4.1–9.4% and SOC content increased by 15–87% in ISSM compared to other farmland management systems. The increased proportion of Methoxy C and O-alkyl C functional groups with a low ratio of Alkyl C/O-alkyl C, but high Aliphatic C/Aromatic C in ISSM hints toward slow SOC decomposition and high soil C quality. The relative abundances of r-strategists (e.g., Firmicutes, Myxobacteria, and Bacteroidetes) was highest under the ISSM. Co-occurrence network analysis revealed highly complex bacterial communities under ISSM, with greater positive links with labile SOC functional groups. The soil fertility index was the main factor fueling crop yields, as it increased with the relative abundance of r-strategists and SOC content. Our results indicated that crop yield advantages in ISSM were linked to the high C quality and shifts in bacterial composition toward r-strategists by mediating nutrient cycling and soil fertility, thereby contributing to sustainability in cropping systems.

1. Introduction

Soil organic matter (SOM) supports multiple ecosystem functions and is closely linked to consistently high crop yields and sustainable agriculture [1,2]. Therefore, maintaining and enhancing SOM content in agricultural fields is important, especially within the context of food security and climate change mitigation [3,4]. Although agricultural land covers 38% of the Earth’s land surface, large areas of agricultural land suffer from medium to strong degradation [5]. Therefore, improving soil organic carbon (SOC) is an efficient way to increase C sinks, reduce greenhouse gas (CO2) emissions, and improve crop productivity in carbon-depleted agricultural soils [6,7].
Inappropriate management has depleted 25–75% of SOC in global cropland [8], resulting in a growing interest in optimizing agricultural management. Current optimization techniques include judicious use of fertilizer, adding manure, or returning straw to the field [9,10,11,12,13]. Straw returns maximize the use of natural resources, improve soil structure, and increase the SOM content, providing an ideal environment for crop plantations [14,15]. Organic fertilizers are rich in organic matter and beneficial microorganisms [16]. Many field trials have shown that long-term organic fertilization can increase the conversion of organic and inorganic materials in the soil, which is conducive to improving soil fertility and promoting crop growth and development. [12,17,18,19].
SOM is chemically diverse and consists of pools with various availability and turnover rates [20,21]. The chemical composition of SOM, which defines its decomposability and stability, is receiving attention in the context of research on soil fertility and quality [22,23]. Intensive management has a direct and indirect impact on the quality and quantity of organic C entering agricultural soils. For instance, organic fertilization generally increases Alkyl C and aromatic C, while decreasing O-alkyl C in soil [23,24]. On the contrary, combined mineral NPK fertilizers (combined with organic manure) increase the O-alkyl group levels but decrease the levels of Alkyl and aromatic groups and the ratio of Alkyl-C/O-alkyl-C (A/O-A) groups [25,26]. The inconsistent compositions of SOM chemical functional groups could be attributable to site-specific soil conditions, input types, climate, and the complexity of the microbial decomposition processes [27,28,29,30].
SOC is considered an overarching edaphic factor that shapes bacterial diversity [12,31,32]. This is because heterotrophic soil microorganisms rely on increased SOC to obtain their nutrients [33,34,35]. After long-term organic matter input, greater SOC is observed, and it is accompanied by greater microbial activity [36,37]. Specifically, when SOC increases, there tends to be a shift in microbial community composition; the community moves toward having more r-strategists compared to unfertilized plots [38]. Beyond determining life history strategies, SOC also determines which bacterial phyla are present in the soil [31,32]; this may result from the ability of the microbial groups to utilize SOC pools [39]. Long-term organic amendments (e.g., sewage sludge and chicken manure) increase the dissolved organic carbon content and support an indicative shift of bacterial community to r-strategist taxa such as Proteobacteria and Actinobacteria [40]. This is because the r-strategists have high nutrient requirements and can maximize their reproductive outputs when resources are abundant [31]. The application of organic fertilizers mitigates the negative effects of mineral fertilization on microbial diversity, and the shift of microbial communities toward r-strategists is owing to the efficient input of C that characterizes organic fertilizers [36,37,38]. All these studies suggest that SOC quality is vital for adjusting microbial community composition and life history.
To increase crop production while minimizing impact on the environment, the integrated soil crop system management (ISSM) strategy was recently introduced. The strategy is based on a Hybrid-Maize simulation model and a seasonal root zone nitrogen management strategy (IRNM) to determine the most appropriate combination of planting date, crop density, and fertilizer application rate at the trial site [41]. ISSM has been shown to increase yields (maize, rice, and wheat) by an average of 10.8–11.5% from 2005–2015 [41,42,43].
Northeast China is considered the “first granary”, with grain production accounting for a quarter of the country’s total grain production [44]. SOC levels in Northeast China have declined by 22% over the past three decades [2,45], and the decrease is mainly due to intensive cropping and inefficient fertilization [46,47]. Therefore, it is crucial to identify appropriate soil management practices that are conducive to soil C sequestration and sustainable development of agricultural ecosystems in this region. In this study, we aimed to (i) compare the changes in total SOC content, chemical functional groups, and bacterial community composition across various farmland management systems; and (ii) explore changes in SOC quantity and quality in relation to bacterial communities and their impact on crop yield. We hypothesize that (1) compared to farmer practice (FP), ISSM will increase SOC, especially the labile functional pools, because of the direct input of nutrients associated with this strategy [48]; (2) changes in SOC quantity and quality in the ISSM system are important factors shaping microbial community composition, with increasing r-strategist bacteria ascribed to preferentially exploit labile organic compounds [49,50]; (3) changes in SOC quantity and quality impact crop yield via regulating bacterial community composition and enhancing soil fertility [18].

2. Materials and Methods

2.1. Study Site

The field experiment was initiated in April 2009 using a maize monoculture, in Zhuling Gong County (43°12′ N, 124°66′ E, 206 m elevation), Ji Lin Province, Northeast China. The site has a temperate continental monsoon climate, an annual precipitation of 595 mm, and an annual mean temperature of 6.3 °C. The soil in this region is classified as Phaeozem (equivalent to Hapudoll as per USDA Soil Taxonomy). At the start of the experiment, the topsoil (0–20 cm) had the following basic characteristics: pH, 6.7; SOC, 16 g kg−1; total N (TN), 1.6 g kg−1; available P (AP), 7 mg kg−1; and available K (AK), 151 mg kg−1. Four farmland management systems were established: (1) farmer practice (FP)—set up based on a survey of various production management systems that local farmers are accustomed to applying; (2) improved farmer practice (IP)—a model based on farmer practice by optimizing the combination of existing techniques (e.g., planting density and fertilizer application) to increase crop yields by 15–20%; (3) high-yield system (HY)—a management model intended to increase crop yield by 30%, regardless of the associated environmental costs; and (4) integrated soil–crop system management (ISSM)—a sustainable integrated program to increase crop yield and resource use efficiency by optimizing planting density, fertilizer application, and tillage systems with the aim of achieving an ultrahigh yield while lowering resource and environmental costs.
The field trial design was a randomized complete block design with four farmland management treatments and four replications, for a total of 16 plots. The size of each plot was 6 m × 23 m. For each farmland management system, details of the fertilization rate, planting density, and straw management are shown in Table 1. Maize (ZhongDan99 cultivar) was sown in late April and harvested in early October. The straw was returned to the field based on the amount of maize root and shoot (leaf and stem) residues after above-ground harvesting in each plot, representing 30% of the total dry matter weight.

2.2. Soil Sampling and Analysis of Physicochemical Properties

Five topsoil cores (0–20 cm depth, 5 cm diameter) were collected at random from each plot in October 2020 and pooled together to form one composite sample per plot, for a total of 16 soil samples. After that, the composite samples were passed through a 2 mm sieve to remove any roots or stones. Each soil sample was stored in three parts: one part was air-dried and stored at room temperature for the determination of various chemical properties, e.g., SOC, TN, pH, AP, and AK; the second sample was stored in a refrigerator at −20 °C for the determination of ammonium (NH4+) and nitrate (NO3) content; the third part was stored at −80 °C and then subjected to DNA extraction and microbial community analysis. Soil samples were collected from 0–20 cm depths using cutting rings of 100 cm3 volume to calculate soil bulk density (BD). All maize plants in each plot were collected at the ripening stage, and the crop yield was analyzed as the dry weight of grains.
The SOC and TN contents were determined through combustion using a Vario EL III Elemental Analyzer (Elementar). Soil available phosphorus (AP) and available potassium (AK) were measured according to Hanway and Heidal (1952) and Olsen (1954) [51,52], respectively. Soil pH was measured using a pH electrode (FE20-FiveEasy pH, Mettler Toledo) with a soil-to-deionized-water ratio of 1:2.5 (w/w). Soil mineral N, including NO3 and NH4+, was extracted with 0.01 mol L−1 KCl solution and analyzed using an auto-analyzer (TRAACS-2000, Bran+Luebbe).
The SOC stock was calculated using the following equation [53]:
S O C   s t o c k s   Mg   C   ha 1 = S O C g   kg 1 × B D g   m 3 × H cm 100
where BD and H represent bulk density and soil depth (0–20 cm), respectively.
The soil fertility index was determined using the averaging approach as follows: to prevent the differences in data scale, TN, AP, AK, NO3, and NH4+ estimated in this investigation were normalized from 0 to 1 using the “max–min” approach, and the soil fertility index was then calculated as follows [54]:
F e r t i l i t y   i n d e x = x i , m i n / ( x i , m a x x i , m i n )
where x i is the measured soil properties, x i , m i n is the minimum of soil properties I, x i , m a x is the maximum of soil properties i.

2.3. Solid-State 13C NMR Spectroscopy

The chemical composition of SOM was investigated by determining the relative abundance of functional groups using solid-state 13C cross-polarization and magic-angle-spin (CPMAS) NMR. Soil samples were treated with a 10% hydrofluoric acid (HF) solution to concentrate the organic matter and remove paramagnetic minerals [55]. The 13C-CPMAS NMR spectra were acquired using an AVANCE III 400 WB spectrometer (Bruker, Billerica, MA, USA) at 100 MHz for 13C and 400 MHz for 1H with a spinning rate of 5 kHz, an acquisition of 20 ms, a recycle time of 1 s, and a contact time of 1 ms.
Bruker TopSpin (v4.1.1) was used to compare the 13C-CPMAS NMR spectra of different samples; peak areas were calculated and integrated to estimate their relative proportions. The methods outlined by Bonanoni et al. were used to select spectral regions and identify C functional groups (chemical structures) [56]: 0–50 ppm, Alkyl C; 50–60 ppm, Methoxyl C; 60–95 ppm, O-alkyl C; 95–110 ppm, Di-O-alkyl C; 110–145 ppm, Aryl C; 145–160 ppm, Phenolic C; and 160–190 ppm, Carboxyl C. In this study, the Methoxyl C, O-alkyl C, Di-O-alkyl C, and Carboxyl C groups were classified as labile C groups, whereas Alkyl C, Aryl C, and Phenolic C groups were classified as recalcitrant C groups [57,58]. Different indices of SOM stability were calculated as follows [59,60]:
The A/O-A (Alkyl C/O-alkyl C) represents the degree of decomposition and was calculated as follows:
A / O - A   r a t i o = A l k y l   C M e t h o x y l   C + O - a l k y l   C + D i - O - a l k y l   C
The Aliphatic C/Aromatic C (Alip/Arom) indicates the degree of aliphaticity, and was calculated using the following equation:
A l i p / A r o m = A l k y l   C + M e t h o x y l   C + O - a l k y l   C + D i - O - a l k y l   C A r y l   C + P h e n o l i c   C
The HB/HI (Hydrophobic C/Hydrophilic C) indicates the hydrophobicity degree, and was calculated using the following equation:
H B / H I = A l k y l   C + A r y l   C + P h e n o l i c   C M e t h o x y l   C + O - A l k y l   C + D i - O - a l k y l   C + C a r b o x y l   C
The Aromaticity response to soil SOC stability was calculated as follows:
A r o m a t i c i t y = A r y l   C + P h e n o l i c   C A l k y l   C + M e t h o x y l   C + O - a l k y l   C + D i - O - a l k y l   C

2.4. DNA Extraction and Amplicon Sequencing

DNA was extracted from fresh soil (0.25 g) according to the manufacturer’s instructions using a PowerSoil kit (MoBio Laboratories, Carlsbad, CA, USA). The DNA extract was tested on a 1% agarose gel, and the concentration and purity of the DNA were determined using a NanoDrop 2000 UV-vis spectrophotometer (ThermoScientific, Wilmington, USA). The hypervariable region V3-V4 of the bacterial 16S rRNA gene was amplified with primer pairs 338F (5′-ACTCCTACGGGAGGCAGCAG-3′) and 806R (5-GGACTACHVGGGTWTCTAAT-3′) using an ABI GeneAmp® 9700 PCR thermocycler (ABI, Carlsbad, CA, USA). The PCR amplification of the 16S rRNA gene was performed as follows: initial denaturation at 95 °C for 3 min, followed by 30 cycles of denaturing at 95 °C for 30 s, annealing at 55 °C for 30 s, and extension at 72 °C for 45 s, then single extension at 72 °C for 10 min, and a final hold at 10 °C. The PCR mixtures contained 4 μL of 5X TransStart FastPfu buffer, 2 μL of 2.5 mM dNTPs, 0.8 μL of forward primer (5 μM), 0.8 μL of reverse primer (5 μM), 0.4 μL of TransStart FastPfu DNA Polymerase, template DNA 10 ng, and finally ddH2O up to 20 μL. The PCRs were performed in triplicate. The PCR product was extracted from 2% agarose gel and purified using the AxyPrep DNA Gel Extraction Kit (Axygen Biosciences, Union City, CA, USA) according to the manufacturer’s instructions and quantified using Quantus™ Fluorometer (Promega, Madison, WI, USA).
Raw amplicon sequences were subjected to quality control using the following criteria: (1) the low-quality sequencing reads which had an average quality score of <20 or contained ambiguous nucleotides were filtered using Mohur version 1.31.1 using the UPARSE (version 7.1) software [61]; and (2) only overlapping sequences longer than 10 bp were assembled according to their overlapped sequence. The maximum mismatch ratio of the overlap region was 0.2. Reads that could not be assembled were discarded; sequences with ≥97% similarity were assigned to one operational taxonomic unit (OTU), and chimeric sequences were identified and removed. Taxonomy was assigned to each OTU by the RDP (Ribosomal Database Project) classifier [62]. The final sequencing products contained 43,750 sequences with an average length of 415 bp per sample for downstream analysis.

2.5. Statistical Analyses

SOC chemical functional groups, bacterial community composition, and other variables were analyzed by SPSS 22.0 (IBM Corp., Armonk, NY, USA) using one-way ANOVA with a randomized group design. Differences were considered significant at p < 0.05, and a post hoc least-significant-difference test was carried out to compare the differences among farmland management systems. The normal distribution of data was tested by using the “Shapiro. test” function of the stats package in R v.4.1.2 (R Core Team, 2021).
Changes in bacterial community composition were evaluated by nonmetric multidimensional scaling (NMDS), based on the Bray–Curtis distance calculation method. To further determine significant differences in bacterial community structure for any pair of samples, Adonis analysis was performed using NMDS and statistical analyses were performed using R (version 4.1.2) with the vegan package (R Core Team, 2021).
Linear discriminant analysis (LDA) effect size (LEfSe) was applied to determine if there were significant differences in bacterial taxa among the four farmland management systems [63]. We performed LDA in combination with Kruskal–Wallis (KW) test to identify species with significant differences in abundance between management systems setting log LDA scores > 2.0 (http://huttenhower.sph.harvard.edu/galaxy/, accessed on 16 November 2022). Circus (https://hiplot.com.cn/, accessed on 16 November 2022) was used to aid in the identification and analysis of similarities and differences resulting from phyla relative abundance comparisons [64], which emphasizes the statistical significance and biological relevance [63].
The co-occurrence networks of bacterial communities with SOC chemical functional groups and bacterial co-occurrence networks under each management system were compared by setting the same metrics (dissimilarity threshold for KLD matrix maxima and Spearman correlation threshold of 0.6) and running the networks using all OTU taxa for the four farmland management systems. For each edge and measure, the reciprocal and bootstrap distributions were generated with 100 iterations. The p-value of the measure was calculated as the area of the mean of the bootstrap distribution and the standard deviation generated by the mean of the Gaussian curve under the reciprocal distribution. The p-values were adjusted using the Benjamini–Hochberg procedure [65,66]. Only the most significant interactions with strong linear connections (r > 0.6) are shown in the network diagram. The nodes in the constructed network represent genus and SOC chemical functional groups, and the edges represent strong and significant correlations between the nodes. Network visualization was conducted using Gephi (version 0.9.2) and Cytoscape (version 3.8.2)(Ideker, 2011). The topological characteristics of the calculated network include positive and negative correlations, nodes, edges, network density, closeness centrality, and betweenness centrality (Tables S4 and S5).
To further elucidate the pathways through which all factors regulate crop yield, partial least-squares path modeling (PLS–PM) and Pearson correlations were performed. Model evaluation was performed based on the goodness of fit (GOF), with a GOF > 0.7 considered an acceptable value. The models were constructed using R (version 4.1.2) (R Core Team, 2021). Ordinary least-squares regression was performed to test the correlation between the factors.

3. Results

3.1. Soil Organic Matter, Soil Fertility, and Crop Yield

Compared with that in the FP, the SOC content increased by 15% in IP, 33% in HY, and 87% in ISSM (p < 0.05; Figure 1a). Correspondingly, the SOC stock increased by 11%, 31%, and 77% under IP, HY, and ISSM, respectively, compared to that in FP (p < 0.05; Figure 1b). Compared to the other three farmland management systems, ISSM increased TN, AP, AK, and NO3 contents (p < 0.05; Table 2). Consequently, ISSM increased the soil fertility (p < 0.05; Figure 1c) approximately four times than FP. The highest crop yield was obtained under ISSM, with a 9.4% increase than FP (Figure 1d).

3.2. Soil Organic Matter Functional Groups Depending on Management Systems

Across all farmland management systems, the proportion of O-alkyl C (27–30%) was the largest, followed by Alkyl C (24–26%), Aryl C (16–21%), and Carboxyl C groups (7.9–9.2%). These four functional groups dominated SOM, accounting for more than 70% of the total functional group spectrum across all management systems (Table S1). Compared with FP, the ISSM increased the levels of Methoxyl C and O-alkyl C groups by 17% and 8.1%, respectively, and decreased Aryl C group levels by 21% (p < 0.05; Figure 2c,d). In general, the ISSM system increased the labile C groups (p < 0.05; Figure 2a). The A/O-A was similar in the FP and IP (0.55–0.60) and lower in ISSM (0.52) (Figure 2e). Among all management systems, the highest Alip/Arom was under ISSM (3.4) (p < 0.05; Figure 2e).

3.3. Bacterial Community Structure Depending on Management Systems

The Shannon index of the bacterial community increased more in ISSM than in FP and HY (p < 0.05; Figure 3a). Management systems changed the soil bacteria community structure, as indicated by NMDS and Adonis tests (p = 0.01; Figure 3b). The pairwise comparison revealed that the soil bacterial community under ISSM was different from that under FP and HY (Table S3). A Mantel test revealed that the major factors shaping bacterial community structure were soil pH (r = 0.74, p < 0.05), AP (r = 0.67, p < 0.05), AK (r = 0.55, p < 0.05), SOC (r = 0.54, p < 0.05), TN (r = 0.40, p < 0.05), and O-alkyl C (r = 0.34, p < 0.05) (Table S4).
Across the farmland management systems, the bacterial community composition was dominated by Actinobacteria (37%), Proteobacteria (26%), and Chloroflexi (10%) (Figure 3c, Table S2). The similarities in the relative abundance of dominant phyla and classes among farmland management systems were further investigated (Figure 3c, Table S2). The relative abundances of r-strategists such as Firmicutes increased 4-fold, whereas those of Myxobacteria and Bacteroidetes (phylum level) increased 0.5-fold in ISSM as compared with those of the other three systems (p < 0.05; Figure 3c, Table S2). The LEfSe also showed that the relative abundances of Firmicutes and Myxobacteria were the highest in ISSM (p < 0.05; Figure 3d and Figure S1) than in other systems. At the class level, the relative abundances of Bacteroidia, Polyangia, Clostridia, Chloroflexi, and Bacilli were higher in ISSM (p < 0.05; Figure 3c, Table S2). Further comparisons revealed that the relative abundances of taxa Clostridia (belonging to the phylum Firmicutes) and Paeniclostridium, Romboutsia, and Terrisporobacter (belonging to the class Clostridia) were higher under ISSM than in other farmland management systems (p < 0.05; Figure 3c and Figure S1, Table S2).

3.4. Bacterial Network and Linkage with SOM Functional Groups Depend on Management Strategy

The node and edge numbers of the bacterial co-occurrence network were high in ISSM, indicating a greater complexity of bacterial communities (Figure 4). The positive correlations between nodes were greater in the ISSM network (73%) than in the FP (16%), IP (30%), and HY (29%) networks (Figure 4a,b). ISSM increased the average clustering coefficient (avg CC), average closeness centrality (avg C), and average betweenness centrality (avg BC), but decreased the average path length (GD) and modularity compared to FP (p < 0.05; Table S5).
Co-occurrence network analysis provided evidence of the correlation between SOC chemical functional groups and bacterial community composition (Figure 5). The network pattern indicated that the correlation between labile C (O-alkyl C, Methoxyl C, and Di-O-alkyl C) and bacterial genera was 1.4 times higher under ISSM than under FP. In particular, positive correlations increased by 34% and negative correlations decreased by 55% (Figure 5a,d; Tables S6 and S7). Notably, labile C and Aryl C were positively correlated with Firmicutes (Clostridia and Bacilli) in ISSM and FP (p < 0.05; Figure 5, Table S7). Additionally, Paeniclostridium, Romboutsia (Clostridia), Psychrobacillus, and Solibacillus (Bacilli), positively correlated with labile C (O-alkyl C, Methoxyl C, and Di-O-alkyl C), were stronger in ISSM than in other systems (p < 0.05; Figure 5d, Table S2). The relative abundances of Fluviicola (Bacteroidetes) and Anaeromyxobacter (Myxobecteria) were positively correlated with Methoxyl C, and the relative abundance of Haliangium (Myxobecteria) was negatively correlated with Aryl C (p < 0.05; Figure 5d, Table S2).

3.5. Linking SOM Quantity and Quality, Microbial Diversity, and Soil Fertility with Crop Yield

The relative abundance of Bacteroidetes, Firmicutes, and Myxobacteria were linked to soil fertility and labile C (Methoxyl C, O-alkyl C, and Di-O-alkyl C), which were positively correlated with SOC (p < 0.05; Figure 6a). PLS-PM analysis showed that crop yield was directly dependent on soil fertility (path coefficient = 0.58; Figure 6b), which was also supported by the Pearson correlations (Figure 6d). The SOC showed the largest effect on fertility via direct (path coefficient = 0.57) and indirect effects (path coefficient = 0.28) on the relative abundance of r-strategists and labile C pools (Figure 6c and Figure S2). Soil fertility and r-strategists increased with SOC and labile C content (Figure 6c). There were corresponding strong positive correlations between the relative abundances of r-strategist bacteria and the labile C groups (p < 0.05; Figure 6d and Figure S3). The effects of labile C and r-strategists on crop yield were indirect rather than direct (Figure 6b,c and Figure S2). Specifically, crop yield increases were directly dependent on soil fertility. The relative abundance of r-strategists, SOC, and soil fertility positively correlated with crop yield (p < 0.05; Figure 6d). The SOC, labile C, and r-strategists accounted for 75% of the soil fertility index, and the soil fertility index explained 33% of the variance in total crop yield (Figure 6b).

4. Discussion

4.1. Integrated Soil–Crop Management System Increases SOM Quantity and Quality

The ISSM increased SOC by 15–87% compared to the other three systems (p < 0.05; Figure 1a), particularly the labile C functional groups (Methoxy C and O-alkyl C) (Figure 2c and Figure 7). Methoxyl C and O-alkyl C are considered readily degradable components [67]. O-alkyl C groups are usually derived from carbohydrates from fresh plant material; for instance, the anomeric C is derived from cellulose and hemicellulose, whereas Methoxyl C groups are derived from fresh lignin and carbohydrates [68]. The increase in SOM, particularly labile functional C groups, may be caused by the following reasons. First, the high planting density and crop residues in ISSM can provide high amounts of labile C such as O-alkyl C [69,70,71]. This is consistent with the highest yield being recorded under the ISSM system (Figure 1). Second, the addition of organic fertilizers in this system resulted in a surplus of carbohydrates, including labile C [72]. Third, organic fertilizers stimulate the degradation of Aryl C groups and consequently form new Methoxyl C and O-alkyl C groups [73,74]. The high accumulation of labile C resulted in high SOC stock (Figure 1b and Figure 2c), supporting our first hypothesis. Additionally, a lower A/O-A ratio in ISSM than in FP (Figure 2e) indicates that the SOC decomposition was slow in ISSM, resulting in more C being accumulated in the soil. These results confirm that the ISSM system reduces CO2 emissions. Consistent with the results estimated by Cui et al. that the CO2 emissions were reduced by 12.9% for the ISSM system-based interventions compared to FP [43]. In addition, the lower A/O-A ratio and higher Alip/Arom (Figure 2e) indicate that the ISSM system not only increases the SOC quantity, but also the quality [75]. In this study, a large amount of organic fertilizer input in ISSM systems has increased the yield and SOC content, but the problem of high nutrient losses to the environment, such as ammonia emissions, nitrate leaching, and denitrification losses, is undeniable. According to previous studies, the comprehensive results showed that ISSM system-based interventions reduced reactive nitrogen losses by 13.3–21.9% and GHG emissions by 4.6–13.2%. The yield-scaled nitrogen footprint averaged 4.6kg reactive nitrogen loss per Mg of maize produced, compared to 6.1 kg Mg−1 without intervention. Similarly, yield-scaled GHG emissions were 328 kg compared to 422 kg CO2 equivalent per Mg for maize, respectively. Farmer practice applied 300 kg−1 ha−1 of N fertilizer, while in ISSM we reduced the N fertilizer application rate to 195 kg ha−1 [43]. According to unpublished data from our group, the N fertilizer utilization rates of the four farm management systems were 37.3 kg kg−1, 59.7 kg kg−1, 39.4 kg kg−1, and 62.7 kg kg−1, respectively, showing that ISSM had the highest N fertilizer utilization rate and relatively reduced N losses. Therefore, ISSM systems are beneficial to C sequestration and environmental protection, and thus may serve as a sustainable farmland management practice.

4.2. Integrated Soil–Crop Management System Links Labile SOC with r-Strategists

Bacterial community composition depends on a set of environmental factors [76]. As shown in Figure 6, the relative abundances of Bacteroidetes, Firmicutes, and Myxobacteria were highly correlated with soil pH, SOC, TN, AP, and AK (Table S5). Soil pH is a vital edaphic factor affecting the diversity and composition of soil bacteria in agricultural and forest soils [77,78,79]. In addition to SOC and pH, other edaphic factors (e.g., TN and AK contents) strongly influenced bacterial diversity (Figure 6a); this is congruent with previous studies [80,81,82,83].
The bacterial co-occurrence network was altered by management systems. The high bacterial network complexity in ISSM (Figure 4, Table S5) is owing to the availability of a diverse range of resources (e.g., increased availability of soil carbon and nutrients, Table 2 and Figure 1a). This is in agreement with the results of studies indicating that increased soil microbial network complexity is tied to resource availability and diversity [84,85,86]. In general, the increased positive correlation and the reduction in the average path lengths in the ISSM co-occurrence network (Figure 4) were indicative of efficient interactions between microorganisms, promoting a denser co-occurrence network [87].
The phyla Firmicutes and Bacteroidetes prefer substrates rich in available C [31,80]. The relative abundance of Firmicutes, Myxobacteria, and Bacteroidetes increased 0.5–4 times more in ISSM than in FP (Figure 3c, Table S2). The higher relative abundance of r-strategists was due to the 25% increase in labile C functional groups (Figure 6d). In particular, Paeniclostridium, Romboutsia (Firmicutes), and Bacteroidetes were positively correlated with labile C (Methoxy C and O-alkyl C) (Figure 5 and Figure 6a), confirming our second hypothesis. The Bacillus (Firmicutes) dominates microbial communities under labile C and available P inputs [88,89]. The relative abundance of r- (copiotrophs) strategists (e.g., Bacteroidetes) increased when the available substrate content in the soil was high (Figure 6a,d). Therefore, the enrichment of r-strategists under ISSM was influenced by substrate efficiency and C quality (Figure 6b). Microorganisms considered “opportunists” (r-strategists) preferentially exploit less-complex organic compounds [12,31,32]. This is also supported by the positive correlations between labile C pools and abundances of r-strategies microbial groups (Figure 6d).

4.3. SOM Quantity and Quality Increased Crop Yield by Regulating Bacterial Community Composition and Enhancing Soil Fertility

Soil quality is the key to achieve high crop productivity, and soil quality is tied to SOC content and composition [90]. ISSM improved soil fertility by increasing the SOC content and abundance of r-strategists (Figure 6b,c), supporting the improvement of soil quality, which is more commonly associated with a transformation of bacterial community structure [91]. Therefore, the bacterial community structure is an effective biomarker for assessing the environmental impact of a wide range of agricultural practices on soil quality [92]. Specifically, significant positive correlations between SOC and soil chemistry were observed (e.g., TN, AP, AK, and NO3), which is suggestive of the coupling between C sequestration and nutrient cycling, a link that explains the increase in soil fertility under ISSM (Figure 6a). Previous studies indicate that combining chemical fertilizers with organic matter such as straw and manure is an effective way to maintain soil productivity [93,94]. Congruent with these results, mixing NPK fertilizer with manure resulted in yields 25% higher than that when the NPK fertilizer was used alone. This result is directly due to enhanced soil nutrients, which leads to increased bacterial diversity [95].
Soil fertility and crop yield were significantly positively correlated (Figure 6b). Moreover, crop yield directly depended on soil fertility, and SOC and labile C indirectly affected crop yield by mediating r-strategists to enhance soil fertility (Figure 6b,c). Our results demonstrate that bacterial communities in carbon-rich soil primarily consist of r-strategist bacteria. These microorganisms are involved in soil nutrient cycling, which can regulate soil fertility and indirectly improve crop yields. The decomposition of plant residues and the soil’s own organic matter in the soil is a biochemical process, through which carbon is returned to the atmosphere in the form of CO2; and nitrogen, phosphorus, sulfur and trace elements are released into the soil in inorganic form for use by higher plants; some nutrients are assimilated by soil microorganisms into microbial biomass and participate in the rapid turnover process of soil microorganisms. The long-term substitution of straw and manure not only accelerated nutrient cycling, but also increased soil quality and crop yields by increasing bacterial diversity and changing the composition and chemical functional groups, which equally support our results [3,96]. Thus, reasonable agricultural management practices to improve soil fertility and C quality and further improve microbial diversity can help maintain sustainable crop production in Northeastern China [97,98,99].

5. Conclusions

Integrated soil–crop system management changed SOC chemical functional group levels, bacterial community structures, and their relationships with crop yield. ISSM enhanced SOC content and improved its quality by increasing labile Methoxyl C and O-alkyl C groups, resulting in a high Alip/Arom ratio. Optimization of farm management systems promotes the correlations between SOC functional groups and bacterial communities, particularly the labile Methoxyl C and O-alkyl C, with Firmicute. SOC content is one of the determinants of soil fertility, while r-strategists and labile C increase with SOC. Crop yield depends directly on soil fertility, while SOC and labile C indirectly affect crop yield by mediating r-strategists to enhance soil fertility. In conclusion, ISSM changed SOC quantity and quality and altered microbial community. Overall, the combined effects of these factors culminated in improved soil quality and productivity. Therefore, it is essential to optimize management strategies to maintain soil quality and long-term sustainability of agricultural production.

Supplementary Materials

The following supporting information can be downloaded at: https://www.mdpi.com/article/10.3390/agriculture13010134/s1, Table S1: Effects of farmland management systems on functional groups of SOC. Table S2: Relative abundance of soil bacteria at the phyla and class level. Table S3: Results of Adonis test for bacterial communities under four farmland management systems. Table S4: Spearman’s rank correlation (R-value) between soil chemical properties and chemical structure of organic carbon and bacterial communities based on Mantel-test. Table S5: Topological properties of the empirical molecular ecological networks (MENs) of bacteria communities at four farmland management systems. Table S6: Topological properties of network of between bacterial taxa and SOC functional groups parameters of soils. Table S7: Detailed network characteristics of interactions between bacterial taxa and SOC functional groups parameters of soils. Figure S1: Linear discriminant analysis (LDA) to identify the taxa leading to community differences for bacteria. FP: farmer practice; IP: improved farmer practice; HY: high yield system; ISSM: Integrated soil-crop system management. Figure S2: Standardized effects of each variable from the partial least squares path analysis (PLS-PM). (a) and (b) represent the standardized direct effects to crop yield and fertility index, (c) and (d) represent the standardized indirect effects. The fertility index was calculated based on the standardized “Max-Min” approach of five soil properties. SOC: soil organic carbon. Labile C: Methoxyl C, O-alkyl C, Di-O-alkyl C, Carboxyl C. The relative abundances of Firmicutes, Myxobacteria, and Bacteroidetes were chosen to r-strategists by principal component analysis. Figure S3: Principal component analysis (PCA) analyzing. The scores of the first PCA axis were used as r-strategists bacteria. The relative abundances of Firmicutes, Myxobacteria and Bacteroidetes were chosen to r-strategists bacteria principal components for analysis. Shaded area is 95% of the confidence interval.

Author Contributions

Conceptualization, J.T. and Q.L.; methodology, validation, and writing—original draft preparation, visualization, Q.L.; writing—review and editing, visualization, J.T, A.K. and Y.K.; resources, Z.S. and Q.G.; supervision, funding acquisition, F.Z. All authors have read and agreed to the published version of the manuscript.

Funding

This research was funded by the National Key R&D Program of China (2022YFD1901300), “Research and Application of Key Technologies for Cultivation of Arable Land Quality and Green Development of Agriculture” program (Z191100004019013), the National Natural Science Foundation of China [grant nos. 32071629], and Agriculture Carbon Neutral Account Establishment Program in Quzhou (202127). We would also like to thank the Beijing Science and Technology Program, Beijing Advanced Disciplines, and the RUDN University Strategic Academic Leadership Program.

Institutional Review Board Statement

Not applicable.

Informed Consent Statement

Not applicable.

Data Availability Statement

The data presented in this study are available on request from the corresponding author.

Conflicts of Interest

The authors declare that they have no conflicts of interest.

References

  1. Schlesinger, W.H. Carbon Sequestration in Soils. Science 1999, 284, 2095. [Google Scholar] [CrossRef]
  2. Zhao, Y.; Wang, M.; Hu, S.; Zhang, X.; Ouyang, Z.; Zhang, G.; Huang, B.; Zhao, S.; Wu, J.; Xie, D.; et al. Economics- and policy-driven organic carbon input enhancement dominates soil organic carbon accumulation in Chinese croplands. Proc. Natl. Acad. Sci. USA 2018, 115, 4045–4050. [Google Scholar] [CrossRef] [PubMed] [Green Version]
  3. Lal, R. Soil Carbon Sequestration Impacts on Global Climate Change and Food Security. Science 2004, 304, 1623–1627. [Google Scholar] [CrossRef] [PubMed] [Green Version]
  4. Paustian, K.; Lehmann, J.; Ogle, S.; Reay, D.; Robertson, G.P.; Smith, P. Climate-smart soils. Nature 2016, 532, 49–57. [Google Scholar] [CrossRef] [PubMed] [Green Version]
  5. Nachtergaele, F.O.; Petri, M.; Biancalani, R.; Lynden, G.V.; Velthuizen, H.V.; Bloise, M. An Information database for Land Degradation Assessment at Global Level; Sciences and Education: Bussum, The Netherland, 2011. [Google Scholar]
  6. Bossio, D.A.; Cook-Patton, S.C.; Ellis, P.W.; Fargione, J.; Sanderman, J.; Smith, P.; Wood, S.; Zomer, R.J.; von Unger, M.; Emmer, I.M.; et al. The role of soil carbon in natural climate solutions. Nat. Sustain. 2020, 3, 391–398. [Google Scholar] [CrossRef]
  7. Bradford, M.; Carey, C.; Atwood, L.; Bossio, D.; Fenichel, E.; Gennet, S.; Fargione, J.; Fisher, J.; Fuller, E.; Kane, D.; et al. Soil carbon science for policy and practice. Nat. Sustain. 2019, 2, 1070–1072. [Google Scholar] [CrossRef]
  8. Lal, R. Intensive Agriculture and the Soil Carbon Pool. J. Crop Improv. 2013, 27, 735–751. [Google Scholar]
  9. Mikha, M.M.; Rice, C.W. Tillage and Manure Effects on Soil and Aggregate-Associated Carbon and Nitrogen. Soil Sci. Soc. Am. J. 2004, 68, 809–816. [Google Scholar] [CrossRef]
  10. Wang, Y.; Hu, N.; Ge, T.; Kuzyakov, Y.; Wang, Z.-L.; Li, Z.; Tang, Z.; Chen, Y.; Wu, C.; Lou, Y. Soil aggregation regulates distributions of carbon, microbial community and enzyme activities after 23-year manure amendment. Appl. Soil Ecol. 2017, 111, 65–72. [Google Scholar] [CrossRef]
  11. Zhao, Z.; Zhang, C.; Zhang, J.; Liu, C.; Wu, Q. Effects of Substituting Manure for Fertilizer on Aggregation and Aggregate Associated Carbon and Nitrogen in a Vertisol. Agron. J. 2019, 111, 368–377. [Google Scholar] [CrossRef]
  12. Tian, J.; Lou, Y.; Gao, Y.; Fang, H.; Liu, S.; Xu, M.; Blagodatskaya, E.; Kuzyakov, Y. Response of soil organic matter fractions and composition of microbial community to long-term organic and mineral fertilization. Biol. Fertil. Soils 2017, 53, 523–532. [Google Scholar] [CrossRef]
  13. Dutta, D.; Singh, V.K.; Upadhyay, P.K.; Meena, A.L.; Kumar, A.; Mishra, R.P.; Dwivedi, B.S.; Shukla, A.K.; Yadav, G.S.; Tewari, R.B.; et al. Long-term impact of organic and inorganic fertilizers on soil organic carbon dynamics in a rice- wheat system. Land Degrad. Dev. 2022, 33, 1862–1877. [Google Scholar] [CrossRef]
  14. Jian, J.; Du, X.; Reiter, M.S.; Stewart, R.D. A meta-analysis of global cropland soil carbon changes due to cover cropping. Soil Biol. Biochem. 2020, 143, 107735. [Google Scholar] [CrossRef]
  15. Wang, Y.; Wu, P.; Mei, F.; Ling, Y.; Wang, T. Does continuous straw returning keep China farmland soil organic carbon continued increase? A meta-analysis. J. Environ. Manag. 2021, 288, 112391. [Google Scholar] [CrossRef]
  16. De Corato, U. Agricultural waste recycling in horticultural intensive farming systems by on-farm composting and compost-based tea application improves soil quality and plant health: A review under the perspective of a circular economy. Sci. Total Environ. 2020, 738, 139840. [Google Scholar] [CrossRef]
  17. Fontaine, S.; Bardoux, G.; Abbadie, L.; Mariotti, A. Carbon input to soil may decrease soil carbon content. Ecol. Lett. 2010, 7, 314–320. [Google Scholar] [CrossRef]
  18. Luo, G.; Li, L.; Friman, V.-P.; Guo, J.; Guo, S.; Shen, Q.; Ling, N. Organic amendments increase crop yields by improving microbe-mediated soil functioning of agroecosystems: A meta-analysis. Soil Biol. Biochem. 2018, 124, 105–115. [Google Scholar] [CrossRef]
  19. Cai, A.; Xu, M.; Wang, B.; Zhang, W.; Liang, G.; Hou, E.; Luo, Y. Manure acts as a better fertilizer for increasing crop yields than synthetic fertilizer does by improving soil fertility. Soil Tillage Res. 2019, 189, 168–175. [Google Scholar] [CrossRef]
  20. Stevenson, F.J. Humus Chemistry: Genesis, Composition, Reactions, 2nd ed.; Wiley: Hoboken, NJ, USA, 1994. [Google Scholar]
  21. Von Lützow, M.; Kögel-Knabner, I.; Ekschmitt, K.; Flessa, H.; Guggenberger, G.; Matzner, E.; Marschner, B. SOM fractionation methods: Relevance to functional pools and to stabilization mechanisms. Soil Biol. Biochem. 2007, 39, 2183–2207. [Google Scholar] [CrossRef]
  22. Jastrow, J.D.; Amonette, J.E.; Bailey, V.L. Mechanisms controlling soil carbon turnover and their potential application for enhancing carbon sequestration. Clim. Change 2007, 80, 5–23. [Google Scholar] [CrossRef]
  23. Wang, Q.; HUANG, Q.; ZHANG, L.; ZHANG, J.; SHEN, Q.; RAN, W. The effects of compost in a rice–wheat cropping system on aggregate size, carbon and nitrogen content of the size–density fraction and chemical composition of soil organic matter, as shown by 13C CP NMR spectroscopy. Soil Use Manag. 2012, 28, 337–346. [Google Scholar] [CrossRef]
  24. Guo, Z.; Zhang, Z.; Zhou, H.; Wang, D.; Peng, X. The effect of 34-year continuous fertilization on the SOC physical fractions and its chemical composition in a Vertisol. Sci. Rep. 2019, 9, 2505. [Google Scholar] [PubMed] [Green Version]
  25. He, Y.T.; He, X.H.; Xu, M.G.; Zhang, W.J.; Yang, X.Y.; Huang, S.M. Long-term fertilization increases soil organic carbon and alters its chemical composition in three wheat-maize cropping sites across central and south China. Soil Tillage Res. 2018, 177, 79–87. [Google Scholar] [CrossRef]
  26. Audette, Y.; Congreves, K.A.; Schneider, K.; Zaro, G.C.; Nunes, A.L.P.; Zhang, H.; Voroney, R.P. The effect of agroecosystem management on the distribution of C functional groups in soil organic matter: A review. Biol. Fertil. Soils 2021, 57, 881–894. [Google Scholar] [CrossRef]
  27. Poeplau, C.; Don, A. Carbon sequestration in agricultural soils via cultivation of cover crops—A meta-analysis. Agric. Ecosyst. Environ. 2015, 200, 33–41. [Google Scholar] [CrossRef]
  28. Shahbaz, M.; Kuzyakov, Y.; Sanaullah, M.; Heitkamp, F.; Zelenev, V.; Kumar, A.; Blagodatskaya, E. Microbial decomposition of soil organic matter is mediated by quality and quantity of crop residues: Mechanisms and thresholds. Biol. Fertil. Soils 2017, 53, 287–301. [Google Scholar] [CrossRef]
  29. Guo, L.B.; Gifford, R.M. Soil carbon stocks and land use change: A meta-analysis. Glob. Change Biol. 2002, 8, 345–360. [Google Scholar] [CrossRef]
  30. Wu, L.; Zhang, W.; Wei, W.; He, Z.; Kuzyakov, Y.; Bol, R.; Hu, R. Soil organic matter priming and carbon balance after straw addition is regulated by long-term fertilization. Soil Biol. Biochem. 2019, 135, 383–391. [Google Scholar] [CrossRef]
  31. Fierer, N.; Bradford, M.A.; Jackson, R.B. Toward an ecological classification of soil bacteria. Ecology 2007, 88, 1354–1364. [Google Scholar] [CrossRef]
  32. Ling, L.; Luo, Y.; Jiang, B.; Lv, J.; Meng, C.; Liao, Y.; Reid, B.J.; Ding, F.; Lu, Z.; Kuzyakov, Y.; et al. Biochar induces mineralization of soil recalcitrant components by activation of biochar responsive bacteria groups. Soil Biol. Biochem. 2022, 172, 108778. [Google Scholar] [CrossRef]
  33. Allison, S.D.; Wallenstein, M.D.; Bradford, M.A. Soil-carbon response to warming dependent on microbial physiology. Nat. Geosci. 2010, 3, 336–340. [Google Scholar] [CrossRef]
  34. Trivedi, D.K.; Ansari, M.W.; Dutta, T.; Singh, P.; Tuteja, N. Molecular characterization of cyclophilin A-like protein from Piriformospora indica for its potential role to abiotic stress tolerance in E. coli. BMC Res. Notes 2013, 6, 555. [Google Scholar] [CrossRef] [Green Version]
  35. Kumar, A.; Kuzyakov, Y.; Pausch, J. Maize rhizosphere priming: Field estimates using 13C natural abundance. Plant Soil 2016, 409, 87–97. [Google Scholar] [CrossRef]
  36. Francioli, D.; Schulz, E.; Lentendu, G.; Wubet, T.; Buscot, F.; Reitz, T. Mineral vs. Organic Amendments: Microbial Community Structure, Activity and Abundance of Agriculturally Relevant Microbes Are Driven by Long-Term Fertilization Strategies. Front. Microbiol. 2016, 7, 1446. [Google Scholar] [CrossRef] [Green Version]
  37. Semenov, M.V.; Krasnov, G.S.; Semenov, V.M.; Ksenofontova, N.; Zinyakova, N.B.; van Bruggen, A.H.C. Does fresh farmyard manure introduce surviving microbes into soil or activate soil-borne microbiota? J. Environ. Manag. 2021, 294, 113018. [Google Scholar] [CrossRef] [PubMed]
  38. Strap, J.L. Actinobacteria–Plant Interactions: A Boon to Agriculture. In Bacteria in Agrobiology: Plant Growth Responses; Maheshwari, D.K., Ed.; Springer: Berlin/Heidelberg, Germany, 2011; pp. 285–307. [Google Scholar]
  39. Bryanin, S.; Abramova, E.; Makoto, K. Fire-derived charcoal might promote fine root decomposition in boreal forests. Soil Biol. Biochem. 2018, 116, 1–3. [Google Scholar] [CrossRef]
  40. Li, X.; Chen, Q.L.; He, C.; Shi, Q.; Chen, S.C.; Reid, B.J.; Zhu, Y.G.; Sun, G.X. Organic Carbon Amendments Affect the Chemodiversity of Soil Dissolved Organic Matter and Its Associations with Soil Microbial Communities. Environ. Sci. Technol. 2019, 53, 50–59. [Google Scholar] [CrossRef] [Green Version]
  41. Chen, X.P.; Cui, Z.L.; Vitousek, P.M.; Cassman, K.G.; Matson, P.A.; Bai, J.S.; Meng, Q.F.; Hou, P.; Yue, S.C.; Romheld, V. Integrated soil–crop system management for food security. Proc. Natl. Acad. Sci. USA 2011, 108, 6399–6404. [Google Scholar] [CrossRef] [Green Version]
  42. Chen, X.; Cui, Z.; Fan, M.; Vitousek, P.; Zhao, M.; Ma, W.; Wang, Z.; Zhang, W.; Yan, X.; Yang, J.; et al. Producing more grain with lower environmental costs. Nature 2014, 514, 486–489. [Google Scholar] [CrossRef]
  43. Cui, Z.; Zhang, H.; Chen, X.; Zhang, C.; Ma, W.; Huang, C.; Zhang, W.; Mi, G.; Miao, Y.; Li, X.; et al. Pursuing sustainable productivity with millions of smallholder farmers. Nature 2018, 555, 363–366. [Google Scholar] [CrossRef]
  44. Li, B.; Liu, Z.; Huang, F.; Yang, X.; Liu, Z.; Wan, W.; Wang, J.; Xu, Y.; Li, Z.; Ren, T. Ensuring National Food Security by Strengthening High-productivity Black Soil Granary in Northeast China. Bull. Chin. Acad. Sci. 2021, 36, 1184–1193. [Google Scholar]
  45. Yan, X.; CAI, Z.; WANG, S.; SMITH, P. Direct measurement of soil organic carbon content change in the croplands of China. Glob. Change Biol. 2011, 17, 1487–1496. [Google Scholar] [CrossRef]
  46. Liang, A.; Yang, X.; Zhang, X.; Mclaughlin, N.; Yan, S.; Li, W. Soil organic carbon changes in particle-size fractions following cultivation of Black soils in China. Soil Tillage Res. 2009, 105, 21–26. [Google Scholar] [CrossRef]
  47. Liu, X.; Han, X.; Song, C.; Herbert, S.J.; Xing, B. Soil Organic Carbon Dynamics in Black Soils of China Under Different Agricultural Management Systems. Commun. Soil Sci. Plant Anal. 2003, 34, 973–984. [Google Scholar] [CrossRef]
  48. Liu, B.; Xia, H.; Jiang, C.; Riaz, M.; Yang, L.; Chen, Y.; Fan, X.; Xia, X. 14-year applications of chemical fertilizers and crop straw effects on soil labile organic carbon fractions, enzyme activities and microbial community in rice-wheat rotation of middle China. Sci. Total Environ. 2022, 841, 156608. [Google Scholar] [CrossRef] [PubMed]
  49. Malik, A.A.; Martiny, J.B.H.; Brodie, E.L.; Martiny, A.C.; Treseder, K.K.; Allison, S.D. Defining trait-based microbial strategies with consequences for soil carbon cycling under climate change. ISME J. 2020, 14, 1–9. [Google Scholar] [CrossRef] [PubMed] [Green Version]
  50. Kuzyakov, Y.; Blagodatskaya, E. Microbial hotspots and hot moments in soil: Concept & review. Soil Biol. Biochem. 2015, 83, 184–199. [Google Scholar] [CrossRef]
  51. Hanway, J.J.; Heidal, H. Soil Analysis Methods Asused in Iowa State College Soil Testing Laboratory; FAO: Rome, Italy, 1952. [Google Scholar]
  52. Olsen, S.R. Estimation of Available Phosphorus in Soils by Extraction with Sodium Bicarbonate; US Department of Agriculture: Washington, DC, USA, 1954.
  53. Novara, A.; Poma, I.; Sarno, M.; Venezia, G.; Gristina, L. Long-Term Durum Wheat-Based Cropping Systems Result in the Rapid Saturation of Soil Carbon in the Mediterranean Semi-arid Environment. Land Degrad. Dev. 2016, 27, 612–619. [Google Scholar] [CrossRef]
  54. Delgado-Baquerizo, M.; Reich, P.B.; Trivedi, C.; Eldridge, D.J.; Abades, S.; Alfaro, F.D.; Bastida, F.; Berhe, A.A.; Cutler, N.A.; Gallardo, A.; et al. Multiple elements of soil biodiversity drive ecosystem functions across biomes. Nat. Ecol. Evol. 2020, 4, 210–220. [Google Scholar] [CrossRef]
  55. Ma, L.; Ju, Z.; Fang, Y.; Vancov, T.; Gao, Q.; Wu, D.; Zhang, A.; Wang, Y.; Hu, C.; Wu, W.; et al. Soil warming and nitrogen addition facilitates lignin and microbial residues accrual in temperate agroecosystems. Soil Biol. Biochem. 2022, 170, 108693. [Google Scholar] [CrossRef]
  56. Bonanomi, G.; Incerti, G.; Giannino, F.; Mingo, A.; Lanzotti, V.; Mazzoleni, S. Litter quality assessed by solid state 13C NMR spectroscopy predicts decay rate better than C/N and Lignin/N ratios. Soil Biol. Biochem. 2013, 56, 40–48. [Google Scholar] [CrossRef]
  57. Baldock, J.A.; Oades, J.M.; Waters, A.G.; Peng, X.; Vassallo, A.M.; Wilson, M.A. Aspects of the chemical structure of soil organic materials as revealed by solid-state13C NMR spectroscopy. Biogeochemistry 1992, 16, 1–42. [Google Scholar] [CrossRef]
  58. Coxall, H.K.; Wilson, P.A.; Pälike, H.; Lear, C.H.; Backman, J. Rapid stepwise onset of Antarctic glaciation and deeper calcite compensation in the Pacific Ocean. Nature 2005, 433, 53–57. [Google Scholar] [CrossRef] [PubMed]
  59. Li, Y.; Jiang, P.; Chang, S.X.; Wu, J.; Lin, L. Organic mulch and fertilization affect soil carbon pools and forms under intensively managed bamboo (Phyllostachys praecox) forests in southeast China. J. Soils Sediments 2010, 10, 739–747. [Google Scholar] [CrossRef]
  60. Boeni, M.; Bayer, C.; Dieckow, J.; Conceição, P.C.; Dick, D.P.; Knicker, H.; Salton, J.C.; Macedo, M.C.M. Organic matter composition in density fractions of Cerrado Ferralsols as revealed by CPMAS 13C NMR: Influence of pastureland, cropland and integrated crop-livestock. Agric. Ecosyst. Environ. 2014, 190, 80–86. [Google Scholar] [CrossRef] [Green Version]
  61. Edgar, R.C. UPARSE: Highly accurate OTU sequences from microbial amplicon reads. Nat. Methods 2013, 10, 996–998. [Google Scholar] [CrossRef]
  62. Cole, J.; Crowle, S.; Austwick, G.; Henderson Slater, D. Exploratory findings with virtual reality for phantom limb pain; from stump motion to agency and analgesia. Disabil. Rehabil. 2009, 31, 846–854. [Google Scholar] [CrossRef]
  63. Segata, N.; Izard, J.; Waldron, L.; Gevers, D.; Miropolsky, L.; Huttenhower, G.C. Metagenomic biomarker discovery and explanation. Genome Biol. 2011, 12, R60. [Google Scholar] [CrossRef] [Green Version]
  64. Krzywinski, M.; Schein, J.; Birol, I.; Connors, J.; Gascoyne, R.; Horsman, D.; Jones, S.J.; Marra, M.A. Circos: An information aesthetic for comparative genomics. Genome Res. 2009, 19, 1639–1645. [Google Scholar] [CrossRef] [Green Version]
  65. Benjamini, Y.; Hochberg, Y. Controlling the false discovery rate: A new and powerful approach to multiple testing. J. R. Stat. Soc. Ser. B Methodol. 1995, 57, 289–300. [Google Scholar]
  66. Benjamini, Y.; Hochberg, Y. On the Adaptive Control of the False Discovery Rate in Multiple Testing with Independent Statistics. J. Educ. Behav. Stat. 2000, 25, 60–83. [Google Scholar] [CrossRef] [Green Version]
  67. Zhang, Y.; Yao, S.; Mao, J.; Olk, D.C.; Cao, X.; Zhang, B. Chemical composition of organic matter in a deep soil changed with a positive priming effect due to glucose addition as investigated by C-13 NMR spectroscopy. Soil Biol. Biochem. 2015, 85, 137–144. [Google Scholar] [CrossRef]
  68. Zhou, Z.; Chen, N.; Cao, X.; Chua, T.; Mao, J.; Mandel, R.D.; Bettis, E.A.; Thompson, M.L. Composition of clay-fraction organic matter in Holocene paleosols revealed by advanced solid-state NMR spectroscopy. Geoderma 2014, 223–225, 54–61. [Google Scholar] [CrossRef]
  69. Arshad, M.A.; Soon, Y.K.; Ripmeester, J.A. Quality of soil organic matter and C storage as influenced by cropping systems in northwestern Alberta, Canada. Nutr. Cycl. Agroecosystems 2011, 89, 71–79. [Google Scholar] [CrossRef]
  70. Shrestha, B.M.; Singh, B.R.; Forte, C.; Certini, G. Long-term effects of tillage, nutrient application and crop rotation on soil organic matter quality assessed by NMR spectroscopy. Soil Use Manag. 2015, 31, 358–366. [Google Scholar] [CrossRef]
  71. Soon, Y.K.; Arshad, M.A.; Haq, A.; Lupwayi, N. The influence of 12 years of tillage and crop rotation on total and labile organic carbon in a sandy loam soil. Soil Tillage Res. 2007, 95, 38–46. [Google Scholar] [CrossRef]
  72. Li, D.; Chen, L.; Xu, J.; Ma, L.; Olk, D.C.; Zhao, B.; Zhang, J.; Xin, X. Chemical nature of soil organic carbon under different long-term fertilization regimes is coupled with changes in the bacterial community composition in a Calcaric Fluvisol. Biol. Fertil. Soils 2018, 54, 999–1012. [Google Scholar] [CrossRef]
  73. De Marco, A.; Spaccini, R.; Vittozzi, P.; Esposito, F.; Berg, B.; Virzo De Santo, A. Decomposition of black locust and black pine leaf litter in two coeval forest stands on Mount Vesuvius and dynamics of organic components assessed through proximate analysis and NMR spectroscopy. Soil Biol. Biochem. 2012, 51, 1–15. [Google Scholar] [CrossRef]
  74. Li, Y.; Chen, N.; Harmon, M.E.; Li, Y.; Cao, X.; Chappell, M.A.; Mao, J. Plant Species Rather Than Climate Greatly Alters the Temporal Pattern of Litter Chemical Composition During Long-Term Decomposition. Sci. Rep. 2015, 5, 15783. [Google Scholar] [CrossRef] [Green Version]
  75. Demyan, M.S.; Rasche, F.; Schulz, E.; Breulmann, M.; Müller, T.; Cadisch, G. Use of specific peaks obtained by diffuse reflectance Fourier transform mid-infrared spectroscopy to study the composition of organic matter in a Haplic Chernozem. Eur. J. Soil Sci. 2012, 63, 189–199. [Google Scholar] [CrossRef]
  76. Garland, G.; Edlinger, A.; Banerjee, S.; Degrune, F.; García-Palacios, P.; Pescador, D.S.; Herzog, C.; Romdhane, S.; Saghai, A.; Spor, A.; et al. Crop cover is more important than rotational diversity for soil multifunctionality and cereal yields in European cropping systems. Nat. Food 2021, 2, 28–37. [Google Scholar] [CrossRef]
  77. Rousk, J.; Bååth, E.; Brookes, P.C.; Lauber, C.L.; Lozupone, C.; Caporaso, J.G.; Knight, R.; Fierer, N. Soil bacterial and fungal communities across a pH gradient in an arable soil. ISME J. 2010, 4, 1340–1351. [Google Scholar] [CrossRef] [PubMed]
  78. Wessén, E.; Hallin, S.; Philippot, L. Differential responses of bacterial and archaeal groups at high taxonomical ranks to soil management. Soil Biol. Biochem. 2010, 42, 1759–1765. [Google Scholar] [CrossRef]
  79. Fierer, N.; Jackson, R.B. The diversity and biogeography of soil bacterial communities. Proc. Natl. Acad. Sci. USA 2006, 103, 626–631. [Google Scholar] [CrossRef] [PubMed] [Green Version]
  80. Ramirez, K.S.; Lauber, C.L.; Knight, R.; Bradford, M.A.; Fierer, N. Consistent effects of nitrogen fertilization on soil bacterial communities in contrasting systems. Ecology 2010, 91, 3463–3470. [Google Scholar] [CrossRef]
  81. Yuan, H.; Ge, T.; Wu, X.; Liu, S.; Tong, C.; Qin, H.; Wu, M.; Wei, W.; Wu, J. Long-term field fertilization alters the diversity of autotrophic bacteria based on the ribulose-1,5-biphosphate carboxylase/oxygenase (RubisCO) large-subunit genes in paddy soil. Appl. Microbiol. Biotechnol. 2012, 95, 1061–1071. [Google Scholar] [CrossRef]
  82. Bergkemper, F.; Schöler, A.; Engel, M.; Lang, F.; Krüger, J.; Schloter, M.; Schulz, S. Phosphorus depletion in forest soils shapes bacterial communities towards phosphorus recycling systems. Environ. Microbiol. 2016, 18, 1988–2000. [Google Scholar] [CrossRef] [Green Version]
  83. De Vries, F.T.; Bloem, J.; Quirk, H.; Stevens, C.J.; Bol, R.; Bardgett, R.D. Extensive management promotes plant and microbial nitrogen retention in temperate grassland. PLoS ONE 2012, 7, e51201. [Google Scholar] [CrossRef] [Green Version]
  84. Barberán, A.; Bates, S.T.; Casamayor, E.O.; Fierer, N. Using network analysis to explore co-occurrence patterns in soil microbial communities. ISME J. 2012, 6, 343–351. [Google Scholar] [CrossRef] [Green Version]
  85. Banerjee, S.; Walder, F.; Büchi, L.; Meyer, M.; Held, A.Y.; Gattinger, A.; Keller, T.; Charles, R.; van der Heijden, M.G.A. Agricultural intensification reduces microbial network complexity and the abundance of keystone taxa in roots. ISME J. 2019, 13, 1722–1736. [Google Scholar] [CrossRef] [Green Version]
  86. Banerjee, S.; Kirkby, C.A.; Schmutter, D.; Bissett, A.; Kirkegaard, J.A.; Richardson, A.E. Network analysis reveals functional redundancy and keystone taxa amongst bacterial and fungal communities during organic matter decomposition in an arable soil. Soil Biol. Biochem. 2016, 97, 188–198. [Google Scholar] [CrossRef]
  87. Yuan, M.M.; Guo, X.; Wu, L.; Zhang, Y.; Zhou, J. Climate warming enhances microbial network complexity and stability. Nat. Clim. Change 2021, 11, 343–348. [Google Scholar] [CrossRef]
  88. Ramirez, K.S.; Craine, J.M.; Fierer, N. Consistent effects of nitrogen amendments on soil microbial communities and processes across biomes. Glob. Change Biol. 2012, 18, 1918–1927. [Google Scholar] [CrossRef]
  89. Jing, Z.; Chen, R.; Wei, S.; Feng, Y.; Zhang, J.; Lin, X. Response and feedback of C mineralization to P availability driven by soil microorganisms. Soil Biol. Biochem. 2017, 105, 111–120. [Google Scholar] [CrossRef]
  90. Lal, R.; Negassa, W.; Lorenz, K. Carbon sequestration in soil. Curr. Opin. Environ. Sustain. 2015, 15, 79–86. [Google Scholar] [CrossRef]
  91. Kennedy, A.C.; Smith, K.L. Soil microbial diversity and the sustainability of agricultural soils. Plant Soil 1995, 170, 75–86. [Google Scholar] [CrossRef]
  92. Sharma, S.K.; Ramesh, A.; Sharma, M.P.; Joshi, O.P.; Karlen, D.L. Microbial Community Structure and Diversity as Indicators for Evaluating Soil Quality. In Biodiversity, Biofuels, Agroforestry and Conservation Agriculture; Springer: Berlin/Heidelberg, Germany, 2010. [Google Scholar]
  93. Steiner, C.; Teixeira, W.G.; Lehmann, J.; Nehls, T.; de Macêdo, J.L.V.; Blum, W.E.H.; Zech, W. Long term effects of manure, charcoal and mineral fertilization on crop production and fertility on a highly weathered Central Amazonian upland soil. Plant Soil 2007, 291, 275–290. [Google Scholar] [CrossRef] [Green Version]
  94. Verma, S.; Sharma, P.K. Long-term effects of organics, fertilizers and cropping systems on soil physical productivity evaluated using a single value index (NLWR). Soil Tillage Res. 2008, 98, 1–10. [Google Scholar] [CrossRef]
  95. Sun, R.; Zhang, X.-X.; Guo, X.; Wang, D.; Chu, H. Bacterial diversity in soils subjected to long-term chemical fertilization can be more stably maintained with the addition of livestock manure than wheat straw. Soil Biol. Biochem. 2015, 88, 9–18. [Google Scholar] [CrossRef]
  96. Liu, H.; Du, X.; Li, Y.; Han, X.; Li, B.; Zhang, X.; Li, Q.; Liang, W. Organic substitutions improve soil quality and maize yield through increasing soil microbial diversity. J. Clean. Prod. 2022, 347, 131323. [Google Scholar] [CrossRef]
  97. Mazzilli, S.R.; Kemanian, A.R.; Ernst, O.R.; Jackson, R.B.; Piñeiro, G. Priming of soil organic carbon decomposition induced by corn compared to soybean crops. Soil Biol. Biochem. 2014, 75, 273–281. [Google Scholar] [CrossRef]
  98. Xie, H.; Li, J.; Zhu, P.; Peng, C.; Wang, J.; He, H.; Zhang, X. Long-term manure amendments enhance neutral sugar accumulation in bulk soil and particulate organic matter in a Mollisol. Soil Biol. Biochem. 2014, 78, 45–53. [Google Scholar] [CrossRef]
  99. Lin, Y.; Ye, G.; Kuzyakov, Y.; Liu, D.; Fan, J.; Ding, W. Long-term manure application increases soil organic matter and aggregation, and alters microbial community structure and keystone taxa. Soil Biol. Biochem. 2019, 134, 187–196. [Google Scholar] [CrossRef]
Figure 1. (a,b) Soil organic carbon content and stock (0–20 cm) under four farmland management systems, (c,d)soil fertility index, and crop yield after 12 years under four farmland management systems: FP: farmer practice; IP: improved farmer practice; HY: high-yield system; ISSM: integrated soil–crop system management. Letters represent significant differences (p < 0.05) among management systems. Error bars indicate standard errors of the mean (n = 4). The fertility index was calculated based on the standardized “max–min” approach of five soil properties.
Agriculture 13 00134 g001
Figure 2. 13C CPMAS NMR spectra of functional groups of SOC (a), and their proportions (bd) and ratios (e) under four farmland management systems: FP: farmer practice; IP: improved farmer practice; HY: high-yield system; ISSM: integrated soil–crop system management. Letters represent significant differences (p < 0.05) among farmer practices. Error bars indicate standard errors of the mean (n = 4). A/O-A, Alkyl C/O-alkyl C; Alip/Arom, Aliphatic C/Aromatic C; HB/HI, Hydrophobic C/Hydrophilic C.
Agriculture 13 00134 g002
Figure 3. Bacterial community profiles in soil under four farmland management systems: FP: farmer practice; IP: improved farmer practice; HY: high-yield system; ISSM: integrated soil–crop system management. (a) Bacterial alpha-diversity (Shannon), (b) nonmetric multidimensional scaling (NMDS) analysis of bacterial community structure based on Bray−Curtis distance, (c) relative abundances of bacterial taxa at the phylum level, (d) the linear discriminant analysis effect size (LEfSe) analysis showed the significantly different taxa of bacterial communities. Letters represent significant differences (p < 0.05) among four farmland management systems. Error bars indicate standard errors of the mean (n = 4).
Agriculture 13 00134 g003
Figure 4. Co-occurrence networks of bacterial communities under four farmland management systems: FP: farmer practice; IP: improved farmer practice; HY: high-yield system; ISSM: integrated soil–crop system management. Node colors indicate phyla (a) and modularity classes (b). The size of each node is proportional to the number of degrees. For visual clarity, co-occurrence networks only show nodes with at least 10 degrees.
Agriculture 13 00134 g004
Figure 5. Network analysis revealing the associations between bacterial taxa and labile (ad) and recalcitrant (eh) SOC functional groups. The co-occurrence network was constructed at the genus level and colored according to the phylum classification. Seven functional groups of SOC functional groups are indicated with red triangles. Red and green lines represent strong linear connections (r > 0.6), respectively. FP: farmer practice; IP: improved farmer practice; HY: high-yield system; ISSM: integrated soil–crop system management. Labile C groups: Methoxyl C, O-alkyl C, Di-O-alkyl C, Carboxyl C. Recalcitrant C groups: Alkyl C, Aryl C, Phenolic C.
Agriculture 13 00134 g005
Figure 6. Correlations of crop yield, fertility index, soil properties, SOM chemical structure, and bacterial communities (a). Partial least-squares path (PLS−PM) analysis for crop yield, showing the relationships among soil fertility index, SOM chemical structure, and bacterial communities. GOF, goodness of fit (b). Black and red solid arrows indicate positive and negative associations, gray dashed arrows indicate insignificant correlations. Standardized total effects of each variable from PLS−PM (c). Regression of multiple factors to study the correlation between the factors (d). The solid line was fitted using ordinary least-squares regression and the shaded area corresponds to the 95% confidence interval. Significance codes: *** p < 0.001, ** p < 0.01, * p < 0.05. The fertility index was calculated based on the standardized “max–min” approach of five soil properties. The r−strategists are the first axis of the principal component analysis based on the three bacterial taxa (Support Infographic Figure S3). SOC: soil organic carbon; TN: total nitrogen; AP: available phosphorus; AK: available potassium; NH4+: ammonium N; NO3: nitrate N.
Agriculture 13 00134 g006
Figure 7. Concept of the effects of farmland management systems on the SOC content and compositions, and bacteria community structure and yield of maize. La: labile C; Re: recalcitrant C; BAC: bacterial community; SOM: soil organic matter; TN: total nitrogen; AP: available phosphorus; AK: available potassium; NO3: nitrate N.
Agriculture 13 00134 g007
Table 1. The detailed field management information for four farmland management systems.
Management
Systems
N
(kg·ha−1)
P2O5
(kg·ha−1)
K2O
(kg·ha−1)
Organic Fertilizers
(kg·ha−1)
Straw ManagementPlanting Density
(Plants·ha−1)
Farmer practice (FP)300120120-30%50,000
Improved farmer practice (IP)1959090-30%60,000
High-yield system (HY)300120120-30%70,000
Integrated soil–crop system management (ISSM)195909010,00030%70,000
FP: farmer practice; IP: improved farmer practice; HY: high-yield system; ISSM: integrated soil–crop system management. Straw management: amount of straw returned to the field.
Table 2. Effects of management systems on soil physicochemical properties in a 12-year field experiment.
Management
Systems
pHTN (g/kg)SOC/TNAP
(mg kg−1)
AK
(mg kg−1)
NO3
(mg N kg−1)
NH4+
(mg N kg−1)
BD
(g m3)
FP5.04 ± 0.07 b1.58 ± 0.10 b10.6 ± 0.46 a85.7 ± 3.08 b223 ± 13.5 c3.57 ± 0.39 b6.32 ± 0.49 bc1.23 ± 0.00 a
IP5.27 ± 0.22 ab1.69 ± 0.03 b11.4 ± 0.31 a84.6 ± 3.76 b241 ± 16.1 bc14.4 ± 0.59 a8.94 ± 0.44 a1.21 ± 0.03 a
HY5.02 ± 0.12 b1.96 ± 0.06 b11.4 ± 0.31 a105 ± 3.99 b309 ± 8.35 b11.1 ± 1.28 a7.79 ± 0.38 ab1.18 ± 0.01 a
ISSM5.70 ± 0.10 a2.87 ± 0.24 a11.0 ± 0.59 a175 ± 20.7 a457 ± 18.8 a14.8 ± 0.69 a5.22 ± 0.55 c1.16 ± 0.01 a
Error bars indicate standard errors of the mean (n = 4). Letters within the same row indicate significant differences among farmland management systems at p < 0.05. SOC: soil organic carbon; TN: total nitrogen; AP: available phosphorus; AK: available potassium; NH4+: ammonium N; NO3: nitrate N; BD: soil bulk density. FP: farmer practice; IP: improved farmer practice; HY: high yield system; ISSM: Integrated soil–crop system management.
Disclaimer/Publisher’s Note: The statements, opinions and data contained in all publications are solely those of the individual author(s) and contributor(s) and not of MDPI and/or the editor(s). MDPI and/or the editor(s) disclaim responsibility for any injury to people or property resulting from any ideas, methods, instructions or products referred to in the content.

