Article

Microbial Biofilm Colonizing Plastic Substrates in the Ross Sea (Antarctica): First Overview of Community-Level Physiological Profiles

by
Gabriella Caruso
1,*,
Giovanna Maimone
1,
Alessandro Ciro Rappazzo
2,
Ombretta Dell’Acqua
3,
Pasqualina Laganà
4 and
Maurizio Azzaro
1
1
National Research Council, Institute of Polar Sciences (CNR-ISP), Section of Messina, Spianata S. Raineri 86, 98122 Messina, Italy
2
Scientific Campus, Ca’ Foscari University, Via Torino 155, 30172 Venice Mestre, Italy
3
National Research Council, Institute of Polar Sciences (CNR-ISP), Section of Venice, Via Torino 155, 30172 Venice Mestre, Italy
4
BIOMORF, University of Messina, Via Consolare Valeria, 98121 Messina, Italy
*
Author to whom correspondence should be addressed.
J. Mar. Sci. Eng. 2023, 11(7), 1317; https://doi.org/10.3390/jmse11071317
Submission received: 12 May 2023 / Revised: 1 June 2023 / Accepted: 27 June 2023 / Published: 28 June 2023
(This article belongs to the Section Marine Ecology)

Abstract

:
The microbial colonization of plastic substrates made of polyvinylchloride (PVC) and polyethylene (PE) was studied in Tethys and Road Bays (Ross Sea, Antarctica) in order to evaluate the metabolic profiles of the plastisphere community in comparison with those of the surrounding waters. PVC and PE panels, mounted on stainless steel structures, were deployed in the austral summer 2017 at 5 and 20 m and recovered one year later at four different stations (Amorphous Glacier-AG was potentially impacted by the ice-melting process, and its control site was within Tethys Bay-TB; Road Bay-RB, close to the wastewater plant of the Italian research station Mario Zucchelli and its control site Punta Stocchino-PTS). Additional panels were settled in Road Bay at 5 m and recovered after three months to follow time variability in the microbial colonization process. At the same times and depths as plastic substrates, water samples were also collected. Carbon substrates’ utilization rates were determined on scraped microbial biofilm and water samples, with a fluorimetric assay based on 96-well Biolog Ecoplates. Complex carbon sources, carbohydrate and amines were the organic substrates that mostly fuelled the community metabolism in the RB area, while in the TB area, in addition to carbohydrates, phosphate carbon compounds and amino acids were also actively utilized. Within Road Bay, small differences in the physiological profiles were found, with higher metabolic rates in the biofilm community after 3 months’ deployment (late austral summer period) compared to 12 months, suggesting that autumn to spring period conditions negatively affected foulers’ metabolism. Moreover, different metabolic profiles between the plastisphere and the pelagic microbial community were observed; this last utilized a higher number of carbon sources, while plastic substrates were colonized by a more specialized community. Higher carbon substrate utilization rates were recorded at RB and AG stations, receiving organic supply from anthropic activity or ice melting sources, respectively, compared to their control sites. These results highlighted the functional plasticity of the microbial community, with the adaptive ability to utilize a diversified range of organic substrates.

1. Introduction

Biofilms are complex microbial structures consisting of aggregates of bacteria, fungi, algae and protozoa within a matrix of extracellular polymeric substances of proteins, lipids and nucleic acids [1]. Within the biofilm layer, specific conditions of nutrients’ and metabolites’ exchange and cell interaction (“quorum sensing”) allow the coexistence of an extremely diversified and specialized community of microorganisms, that start the process of microbial colonization (“fouling”) of submerged substrates [2,3]. Biofilm formation is affected by nutrient availability, geochemical conditions, presence of inhibitors (wastes, contaminants, antimicrobial products), and the typical properties (hydrodynamic variables, nutrient enrichment, surface hydrophobicity, surface charge, etc.) of the environment [2].
Within the Antarctic environments, plastic pollution is, as of recently, viewed as an emerging threat [4] and there is a growing concern for the yet-unknown impacts of synthetic polymers on the biotic and abiotic natural domains, i.e., refs. [5,6,7,8,9]. Indeed, plastic particles may cause severe effects on both the environment and biota not only by themselves, but also due to the “plastisphere” ecosystem serving as a potential carrier of pathogens, antibiotic-resistant bacteria and chemical contaminants [10].
Since the term “plastisphere” was assigned to plastic-associated microbial communities [11], several studies have addressed the interaction of plastic polymers with the marine microorganisms and the role of different drivers (i.e., geographical area, polymeric nature, seasonality), in shaping the plastisphere community [12,13]. Comparison between different plastic polymers highlighted the lack of significant variations in terms of composition of the associated microbial community [14]; however, controversial findings have been collected regarding this feature [5,15]. Moreover, in Antarctica current datasets on plastic particles’ distribution are limited to some regions only, making the available information on their chemical composition, sources and fate still fragmentary [4,8,9]. As a consequence, to date, research on plastisphere composition and metabolism in the Antarctic and sub-Antarctic region are only just emerging [7,8,9,16,17,18,19,20,21].
Antarctic marine ecosystems host a variety of psychrophilic microbial communities, well-adapted to these cold habitats, characterized by high biodiversity and heterogeneity at a microscale level [22]. In the last three decades, extensive literature has focused on the Ross Sea as a critical site to study the effects of rapidly changing physical and biological scenarios (i.e., surface-water warming and salinity change, massive loss of ice shelves, retreat of glaciers, seasonal sea-ice reduction [23]) on the overall functioning of the Antarctic marine ecosystem. Previous studies explored the structure and composition of prokaryotes inhabiting the pelagic and benthic domains of the Ross Sea [24,25,26,27] as well as the biological communities of the benthic fauna [28]. Conversely, relevant knowledge gaps on the dynamics of the microbial assemblage as the pioneer colonizing community during the fouling process in this extreme environment still exist. As a consequence, some relevant questions remain unsolved, like: (i) how functionally complex is the Ross Sea plastisphere?; (ii) does the Ross Sea plastisphere community metabolism differ from the surrounding, free-living microbial community?; and (iii) could the plastisphere serve as a potential reservoir of producers of novel enzymes and specialized metabolites?
As a first contribution to assessing the functional diversity of the plastisphere community, biofouling as a key ecological niche for microbial and larval invertebrate communities in the Ross Sea was studied. The objective was to investigate the carbon substrate utilization profiles of the microbial biofilm community colonizing the surface of polyvinyl chloride (PVC) and polyethylene (PE) panels, in comparison with the surrounding seawater. As community-level physiological profiles provide valuable insights on the functional metabolism of microbial biofilm communities [29,30,31,32], the assessment of metabolic spectra of the plastisphere communities was also used as a novel approach to explore their biotechnological potential in terms of associated enzymes.

2. Materials and Methods

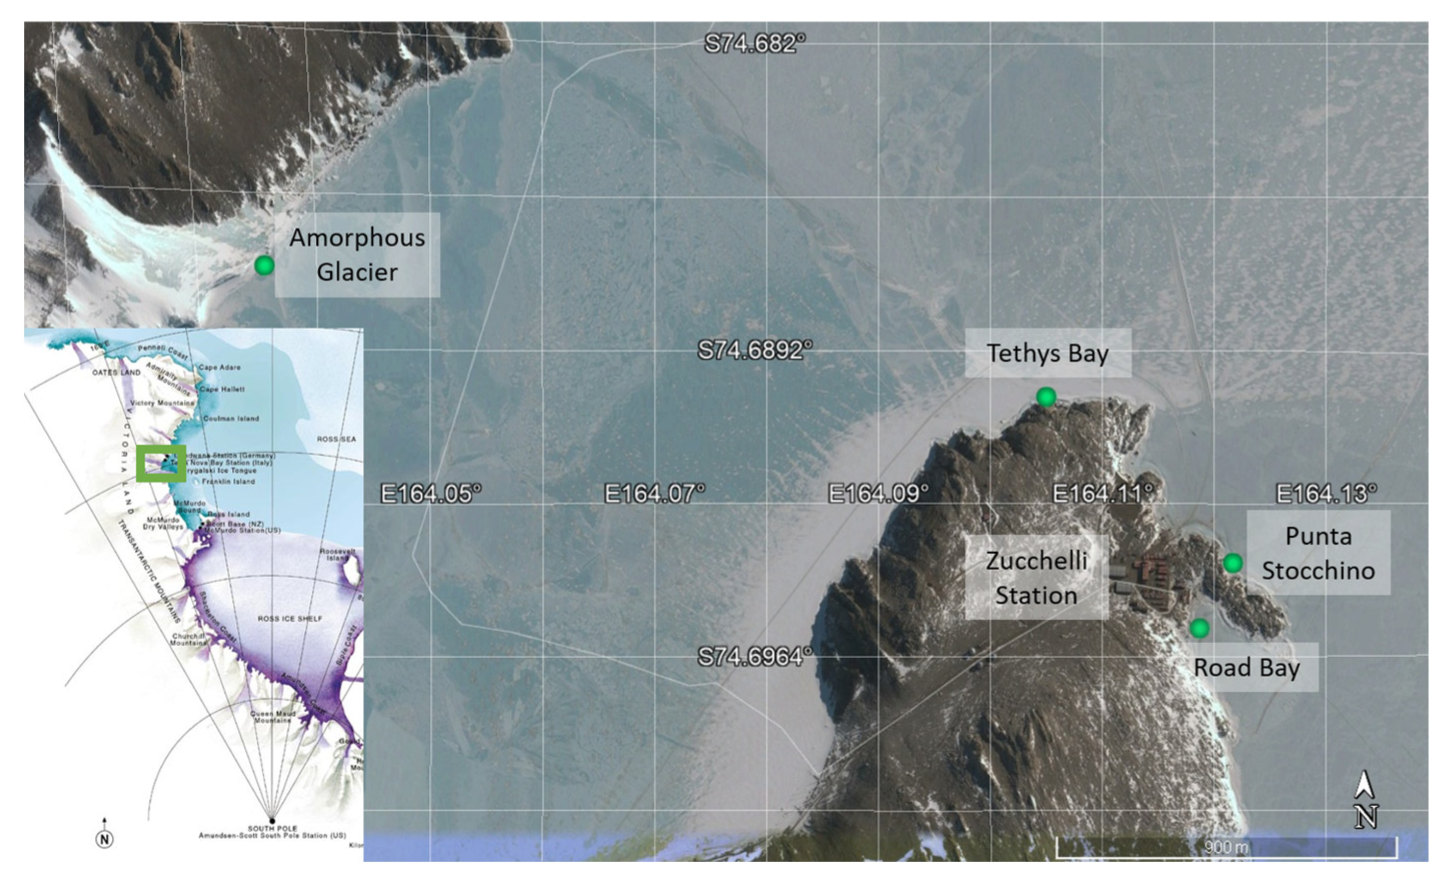
2.1. Colonization Experiment

This experiment was performed in two different sites of Terra Nova Bay (Ross Sea): Road Bay (RB) and Tethys Bay (TB). RB is close to Mario Zucchelli station, exposed to human-derived contamination from the research activities; TB is characterized by salinity gradients in relation to the presence of the Amorphous Glacier. Four different stations, two per area, specifically Road Bay (RB) and Punta Stocchino (PTS) for the study of RB area, and Tethys Bay (TB) and Amorphous Glacier (AG) for the study of the TB area, were chosen for this study (Figure 1).

2.2. Experimental Design

The experiment started in November 2017 (austral summer), when, during the 33rd Italian expedition, artificial panels (18 cm × 18 cm) of polyvinylchloride (PVC) and polyethylene (PE), mounted on stainless steel structures, were deployed and anchored to the sea bottom of the four stations at −5 and −20 m depths. In both the areas, to follow colonization occurring over a long-term time scale, the panels were left undisturbed and recovered after 12 months of immersion (T12), during the 34th Italian expedition (November 2018). In RB and PTS, to study colonization patterns over a middle-term time scale, additional PVC and PE panels were deployed at −5 m and recovered after three months (late summer, T3) and substituted with new ones. These last panels were left immersed for 9 months (T9) and were recovered together with the panels initially deployed (T12). To compare water and biofilm microbial communities, water samples were collected at the same times and depths as plastic panels.

2.3. Sample Treatment

Once PVC and PE panels were collected, they were stored in sterile bags and transported to the Zucchelli station laboratory under refrigerated conditions. Care was taken to avoid external contamination, reducing their handling to the minimum necessary. At the laboratory, microbial biofilms were removed from a portion of 54 cm2 of each PVC and PE panel which was scraped using a sterile cell scraper and collected into a sterile Petri dish, then weighed and stored into sterile 50 mL Falcon tubes at −20 °C until their analysis at the CNR-ISP laboratory, in Italy. After sonication for 2 min, the collected biofilm was diluted with sterile seawater (1:50 w/v); this suspension was used as an extract for the functional analysis.

2.4. Carbon Substrate Utilization Patterns of the Microbial Biofilm Community

Community physiological profiles were determined on scraped microbial biofilm and water samples, using 96-well Biolog Ecoplates (Biolog, Hayward, CA, USA) containing 31 carbon sources and a control in triplicate together with the redox dye tetrazolium violet. The metabolic potentials of microbial assemblages were quantified as the optical density (OD) values of the formazan produced by oxidation of the carbon sources; the absorbance was recorded at 590 nm excitation wavelengths using a microplate reader spectrophotometer (Multiskan GO UV/VIS Spectrophotometer, Thermo Fisher, Waltham, MA, USA), according to the analytical procedure commonly used in our laboratory [33,34]. Each well was filled with 150 µL of sample and the OD values were recorded at 4 °C at time T0 (immediately after microplate inoculation), and then measurements were performed every 48 h of incubation at 4 °C in the dark under aerobic conditions for the first 4 days and thereafter at one-week intervals up to 456 h to follow the colour development in the microplate wells.
As reported by Sala et al. [35], the color development in each plate was expressed as the average substrate color development (ASCD), which was calculated according to the equation below:
ASCD = Σ ((R − C)/31)
where R was the average absorbance of the three wells inoculated with the substrate and C was the average absorbance of the control wells (without the substrate). The percentages of absorbance were determined for each substrate following Sala et al. [36], using a value of 2% of the total absorbance measured per plateas the threshold value for substrate utilisation.
Six main categories of carbon substrates were considered: complex carbon sources, carbohydrates, phosphate carbon sources, carboxylic and acetic acids, amino acids and amines.

2.5. Statistical Analysis

Normal distribution was assumed, and normality tests were performed prior to statistical analysis. Box-plots showing the spatial trend of microbial community metabolic profiles in each study area were prepared with the PAST software v. 4.0 [37]. Analysis of Variance (ANOVA) followed by Tukey’s pairwise comparison analysis was carried out to determine whether and to what extent data measured at each area (RB and TB) were significantly different in relation to the matrix (PVC and PE biofilm, water). In RB area, the significance of microbial metabolic differences occurring over time within the 5-m depth at the stations RB and PTS was assessed using the Repeated measure function of the PAST software.
Multivariate statistical analysis of plastisphere and water community metabolic patterns was carried out using the PRIMER v.6 software (PRIMER-E Ltd., Plymouth, UK) [38]. A Non-parametric MultiDimensional Scaling (nMDS) analysis was performed on a Bray–Curtis similarity matrix of the normalized data to obtain a bi-dimensional representation of the PVC and PE biofilm and water samples. A multivariate analysis of similarity (ANOSIM) was further applied with the aim of assessing whether the samples were significantly separated; a similarity percentage (SIMPER) analysis was used to measure the relative percentage contribution of each variable (i.e., carbon substrate) to the average dissimilarity of data. These statistical elaborations were carried out on the OD values normalized by the respective ASCD value.
Diversity indices such as the species richness (S), the Margalef’s species richness index (d) [39], the Shannon-Wiener diversity index (H′ [40], and Pielou’s species evenness index (J′) [41] were calculated by the PRIMER software and graphically visualized by the PAST software to highlight the alpha-diversity among data.
To build from the raw sample reads, a hierarchy of clusters based on the stations and substrates, a two-ways (stations × substrates) hierarchical clustering analysis was performed by the PAST software using the Euclidean algorithm and unweighted average linkage clustering (UPGMA) options.

3. Results

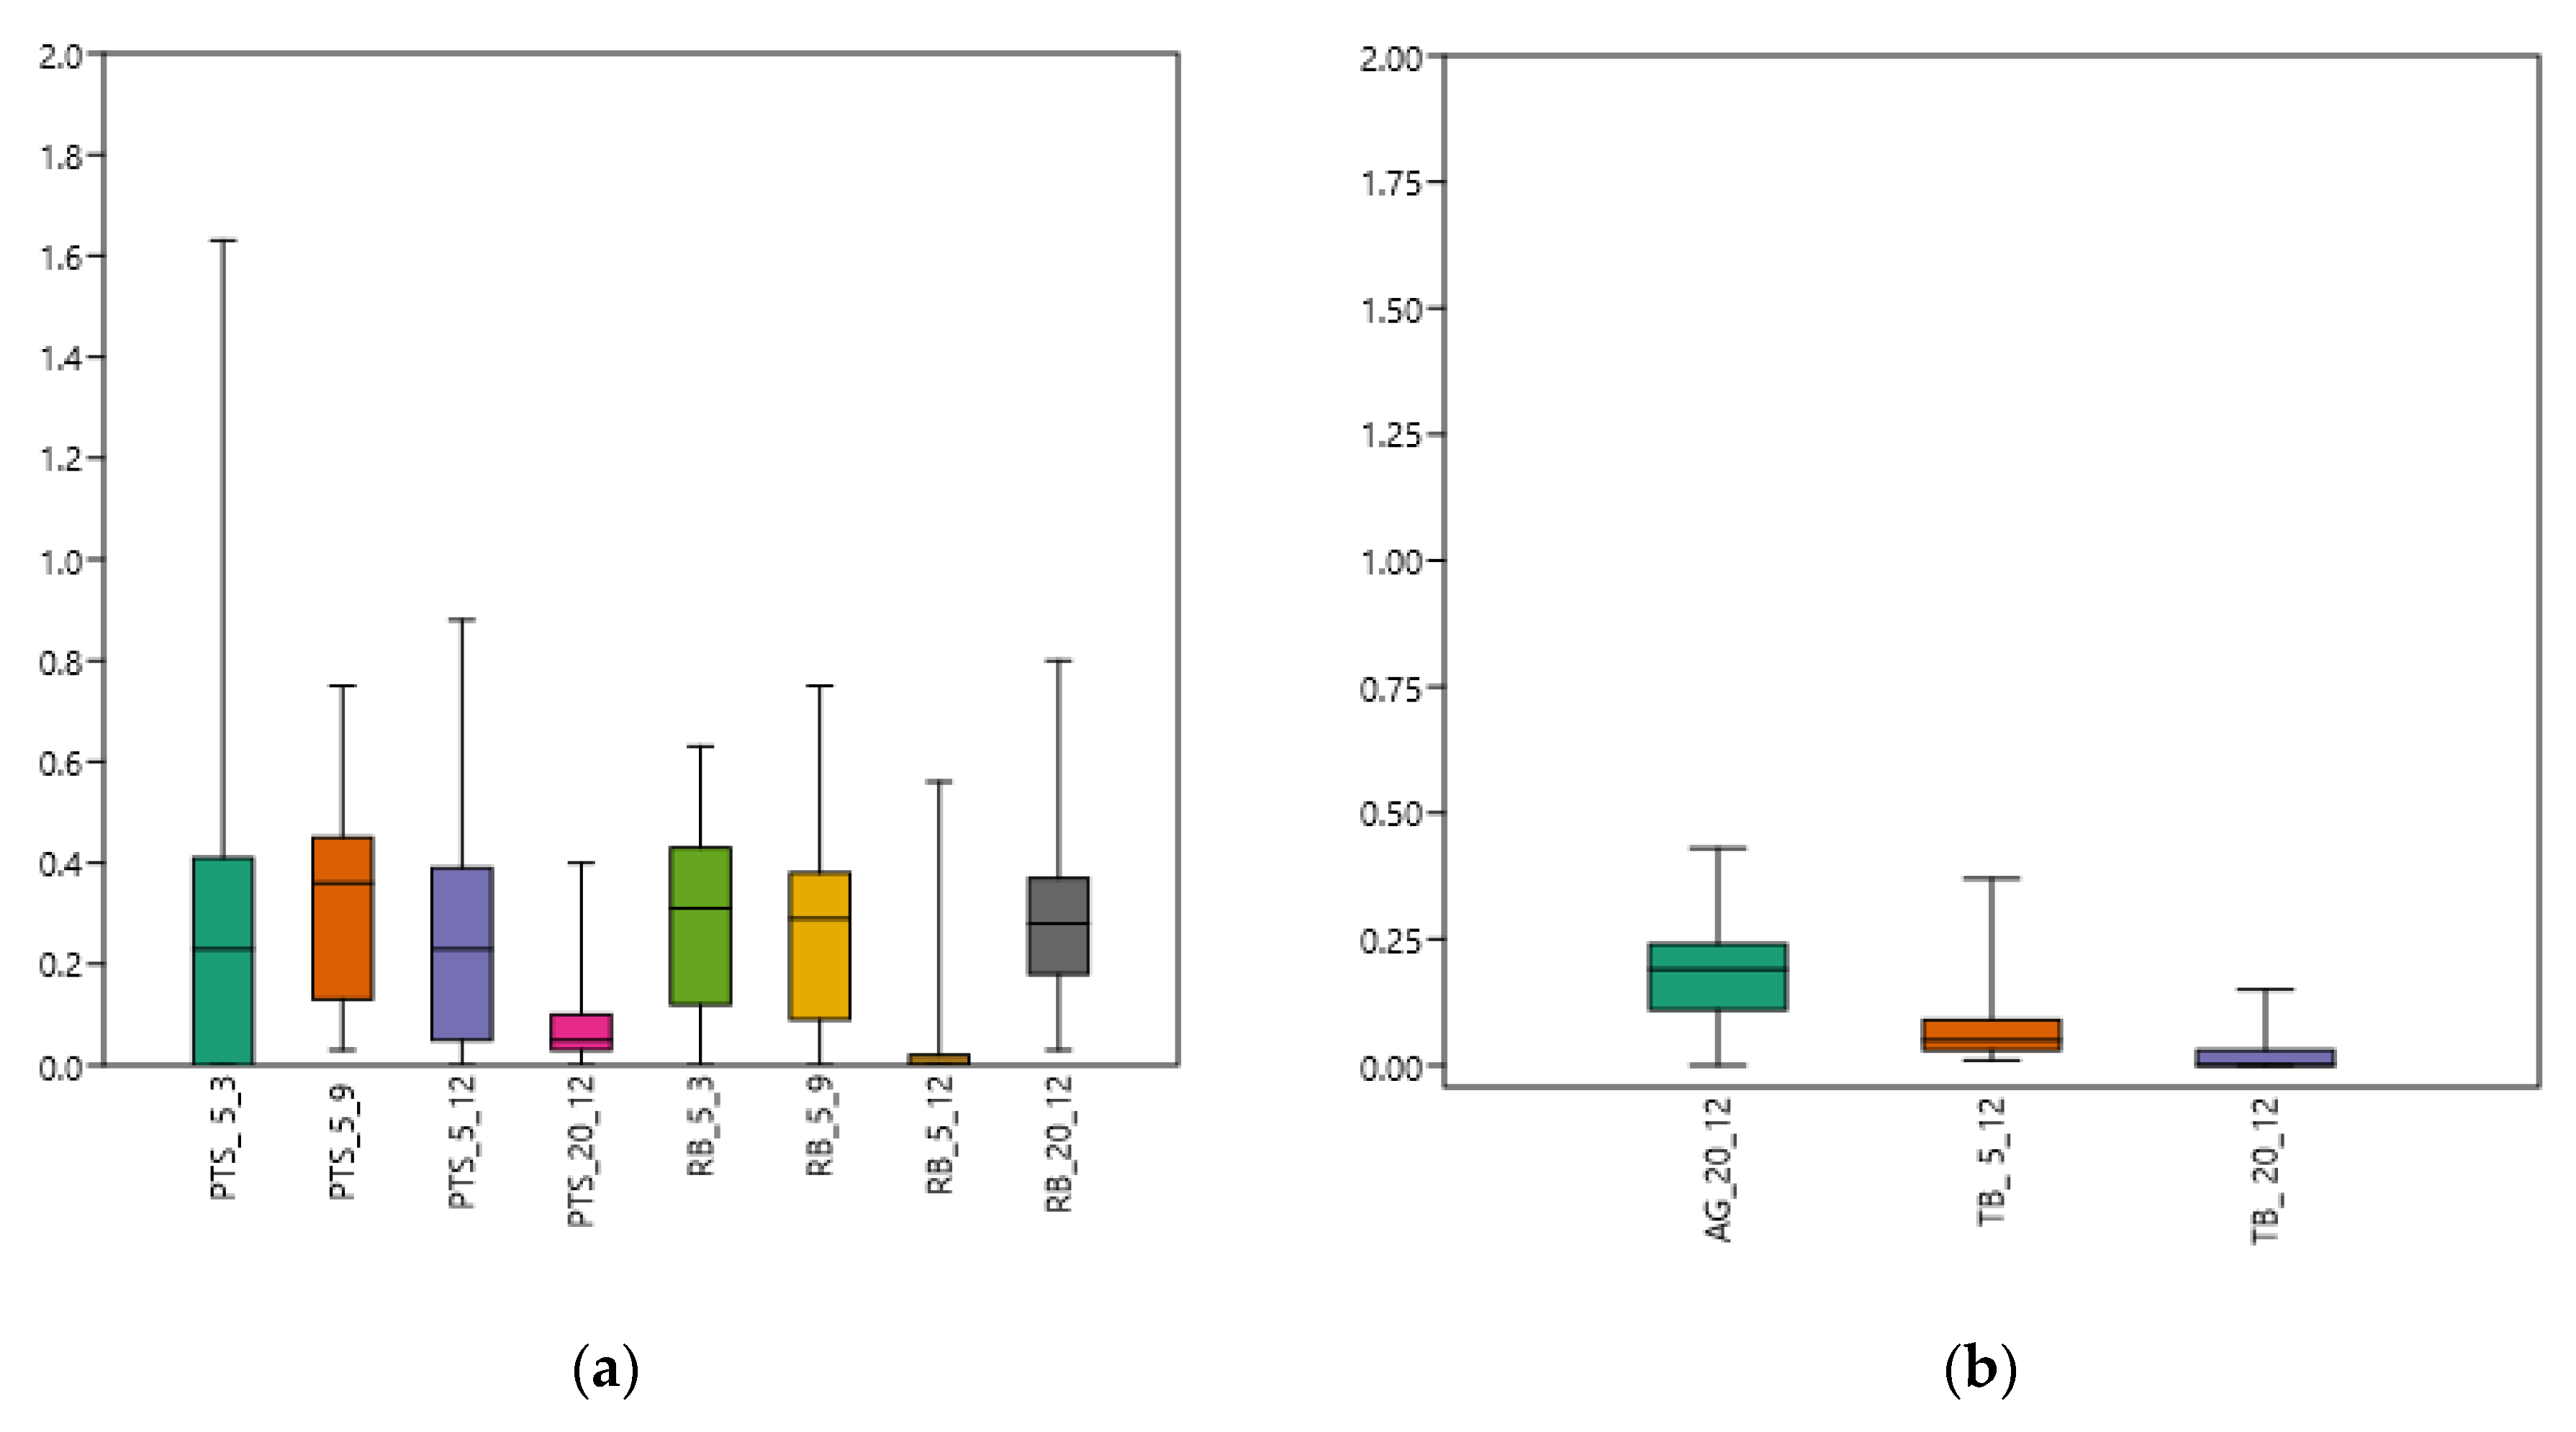
3.1. Carbon Substrate Utilization Patterns in Microbial Biofilm Community

Regarding the ASCD, differences were observed in the incubation time needed to achieve a peak value in the OD, depending on the analysed sample (plastisphere or water) (Table 1). As expected, longer times were recorded for the water compared to biofilm samples. Generally, for biofilm samples, the peak was reached after 48 h of incubation. PVC and PE biofilm bacteria showed similar values, ranging from 0 to 0.81 with an average value of 0.13.

3.2. Microbial Community on PVC Panels

3.2.1. Spatial Variability in Metabolic Utilization Rates

In the Road Bay area (Figure 2a), the PVC-associated microbial community showed a greater ability to use carbon substrates at the RB station compared to the PTS station, and with greater efficiency at 5 m than at 20 m. With respect to the categories of organic compounds, carbohydrates and complex carbon sources were the most used (Figure S1A); specifically, Tween 80 and Tween 40 among complex carbon sources and D-xylose, a-D-lactose and D-mannitol among carbohydrates were preferentially used by the microbial community (Figure S2A). Furthermore, L-arginine and L-serine among the amino acids and D-galactonic acid, y-hydroxybutyric acid and D-malic acid among the carboxylic acids were efficiently metabolised.
In the Tethys Bay area (Figure 2b) the biofilm microbial community showed utilization patterns higher at the AG station, presumably affected by detrital inputs from the glacier, than at the TB one. Amines and complex carbon sources were the most actively consumed organic substrates (Figure S1B), with the preferential use of phenyl-ethyl amine and Tween 40, respectively (Figure S2B). Itaconic acid and D-glucosamic acid were the most used carboxylic acids, while Glycyl-L-glutamic acid and L-threonine were the most used amino acids (Figure S2B).

3.2.2. Time Variability in Metabolic Utilization Rates

Carbon substrate utilization patterns over a time scale were detected only in the RB area (Figure 2a). Community-level physiological profiles highlighted that microbial metabolism was already enhanced at T3 at both stations, with OD values of 0.229 and 0.218 (at the PTS and RB stations, respectively). At the RB station, the metabolic levels also remained high after the autumn-winter period (OD value 0.241 at T9), and slightly decreased in the successive summer (OD value 0.197 at T12). At the PTS station, low metabolic activity levels were noticed after 12 months of immersion.

3.3. Microbial Community on PE Panels

3.3.1. Spatial Variability in Metabolic Utilization Rates

The Road Bay area (Figure 3a) was characterized by a microfouling community on PE that, excepting T12, was more active at the RB_5 station compared to the PTS_5 station; amines and phosphate-carbon compounds were preferentially metabolised (Figure S1C). With respect to single substrates, putrescine and pyruvic acid methyl were mostly used (Figure S2C).
The microfouling community observed on PE panels recovered from the Tethys Bay area (Figure 3b) showed the highest metabolic activities at the AG_20 station. Carbohydrates, amines, and phosphate-carbon compounds were the most used substrates (Figure S1D); N-acetyl-D-glucosamine and i.-erythritol were the preferred sources of carbon. High activity rates were observed for complex carbon sources, especially Tween 40, and for carboxylic acids, i.e., 2-hydroxybenzoic acid (Figures S1D and S2D). Among the amino acids, L-asparagine, L-serine and L-threonine were the most metabolized compounds (Figure S2D).

3.3.2. Time Variability in Metabolic Utilization Rates

High community metabolism was recorded in the Road Bay area, especially at the earliest colonization phase (T3, Figure 3a) (average OD values 0.328 and 0.298 measured at RB and PTS stations, respectively) corresponding to the late summer season. Carbon substrate utilization by the microbial community also proceeded at high rates during the successive sampling time (T9, referable to the autumn). Particularly at the PTS station, an opposite pattern to the PVC-associated community was found. Thereafter, a decline in metabolic activities was recorded.

3.4. Water Samples

3.4.1. Spatial Variability in Metabolic Utilization Rates

Differently from the biofilm community, the microbial community inhabiting the Road Bay waters (Figure 4a) showed the highest metabolic rates at the PTS station at greater depths (20 m at T3), compared to the RB station where metabolic activities did not exceed mean OD values of 0.3. Moreover, high activity levels were recorded at depth 20 m, too. Carbohydrates and amino acids were the preferentially metabolised compounds (Figure S1E); among this first group, α-D-lactose and D-xylose were mainly used, while among this second group, L-asparagine and L-threonine were mainly used (Figure S2E). Among the carboxylic acids, D-glucosamic acid and y-hydroxy butyric acid were the most utilized carbon substrates (Figure S2E).
In the Tethys Bay area (Figure 4b), the microbial community was more active at the TB station compared to the AG station; carbohydrates and phosphate-carbon compounds were the mostly used substrates (Figure S1F).
With respect to the single substrates (Figure S2F), α-D-lactose, D-mannitol and N-acetyl-D-glucosamine were preferentially metabolized among the carbohydrates, while among the complex carbon sources, Tween 40 was preferentially metabolised. D-glucosamic acid and y-hydroxy-butyric acid were the most used carboxylic acids; among the amino acids, L-arginine and L-threonine were preferentially used (Figure S2F).

3.4.2. Time Variability in Metabolic Utilization Rates

In the RB area, microbial metabolism increased over sampling time at both stations at 5 m. Regarding the 20 m depth, at the PTS station similar values were found at T3 and T12, while at the RB station an increase of metabolic rates was found.

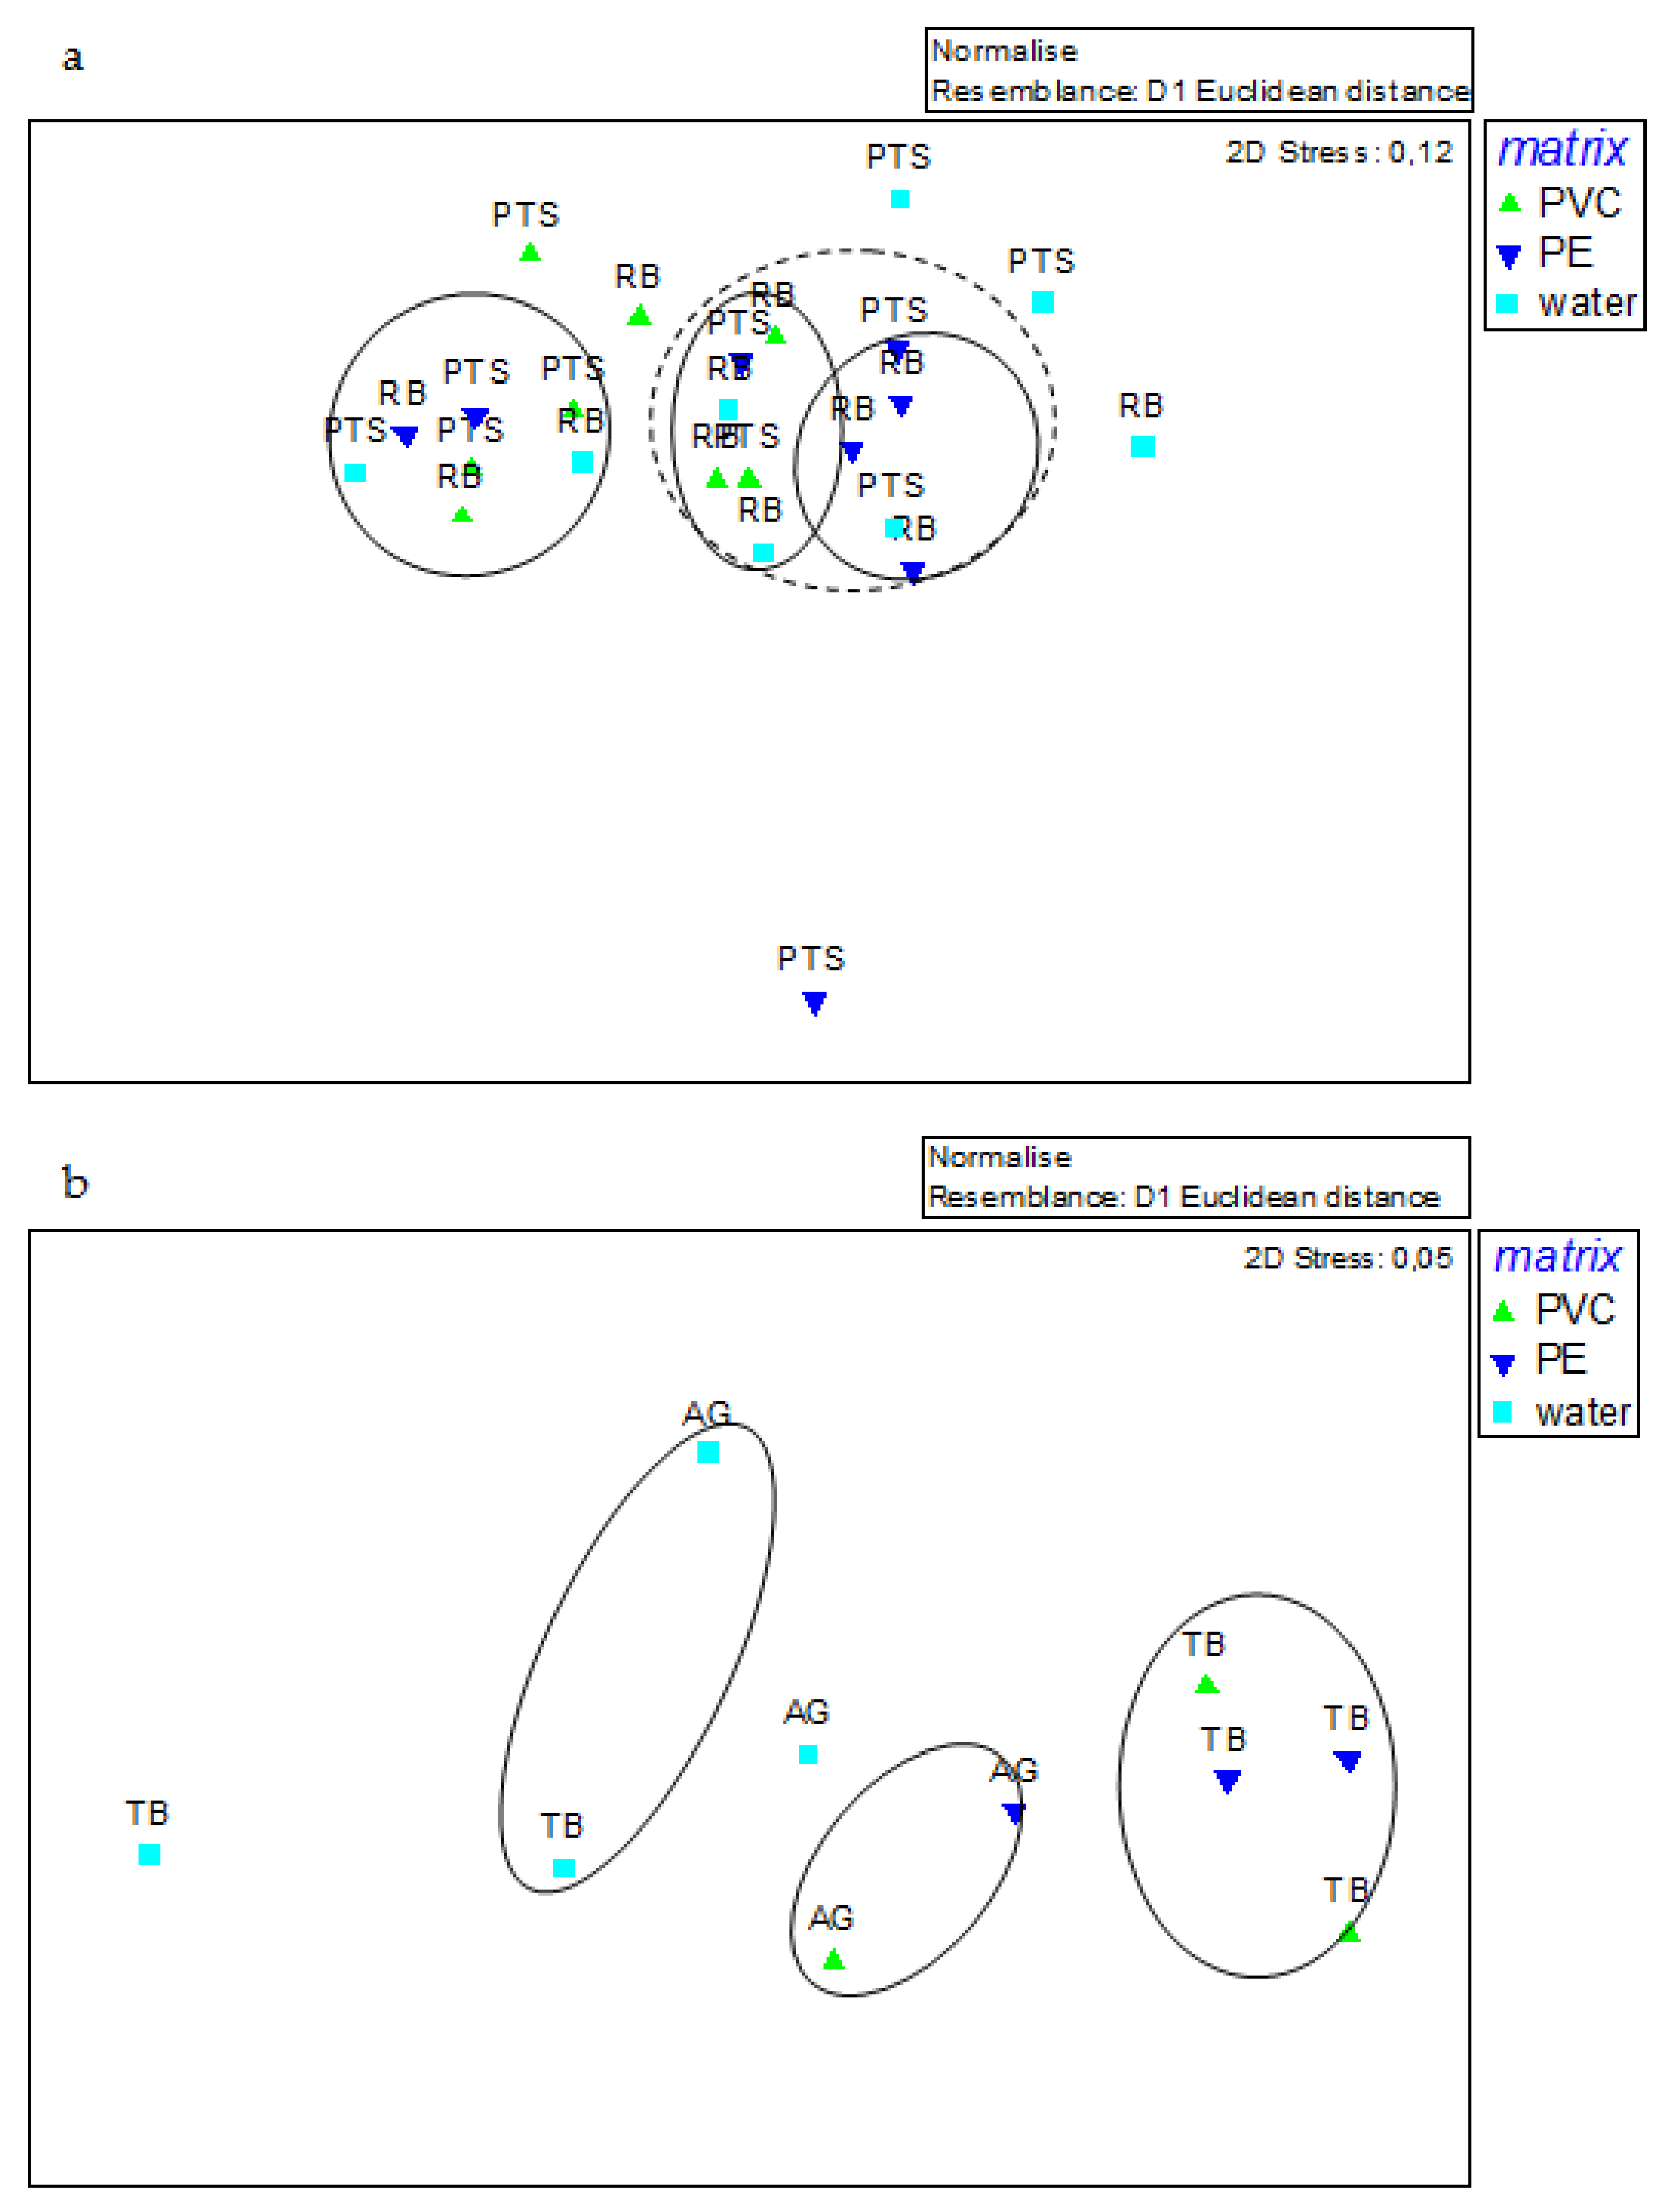
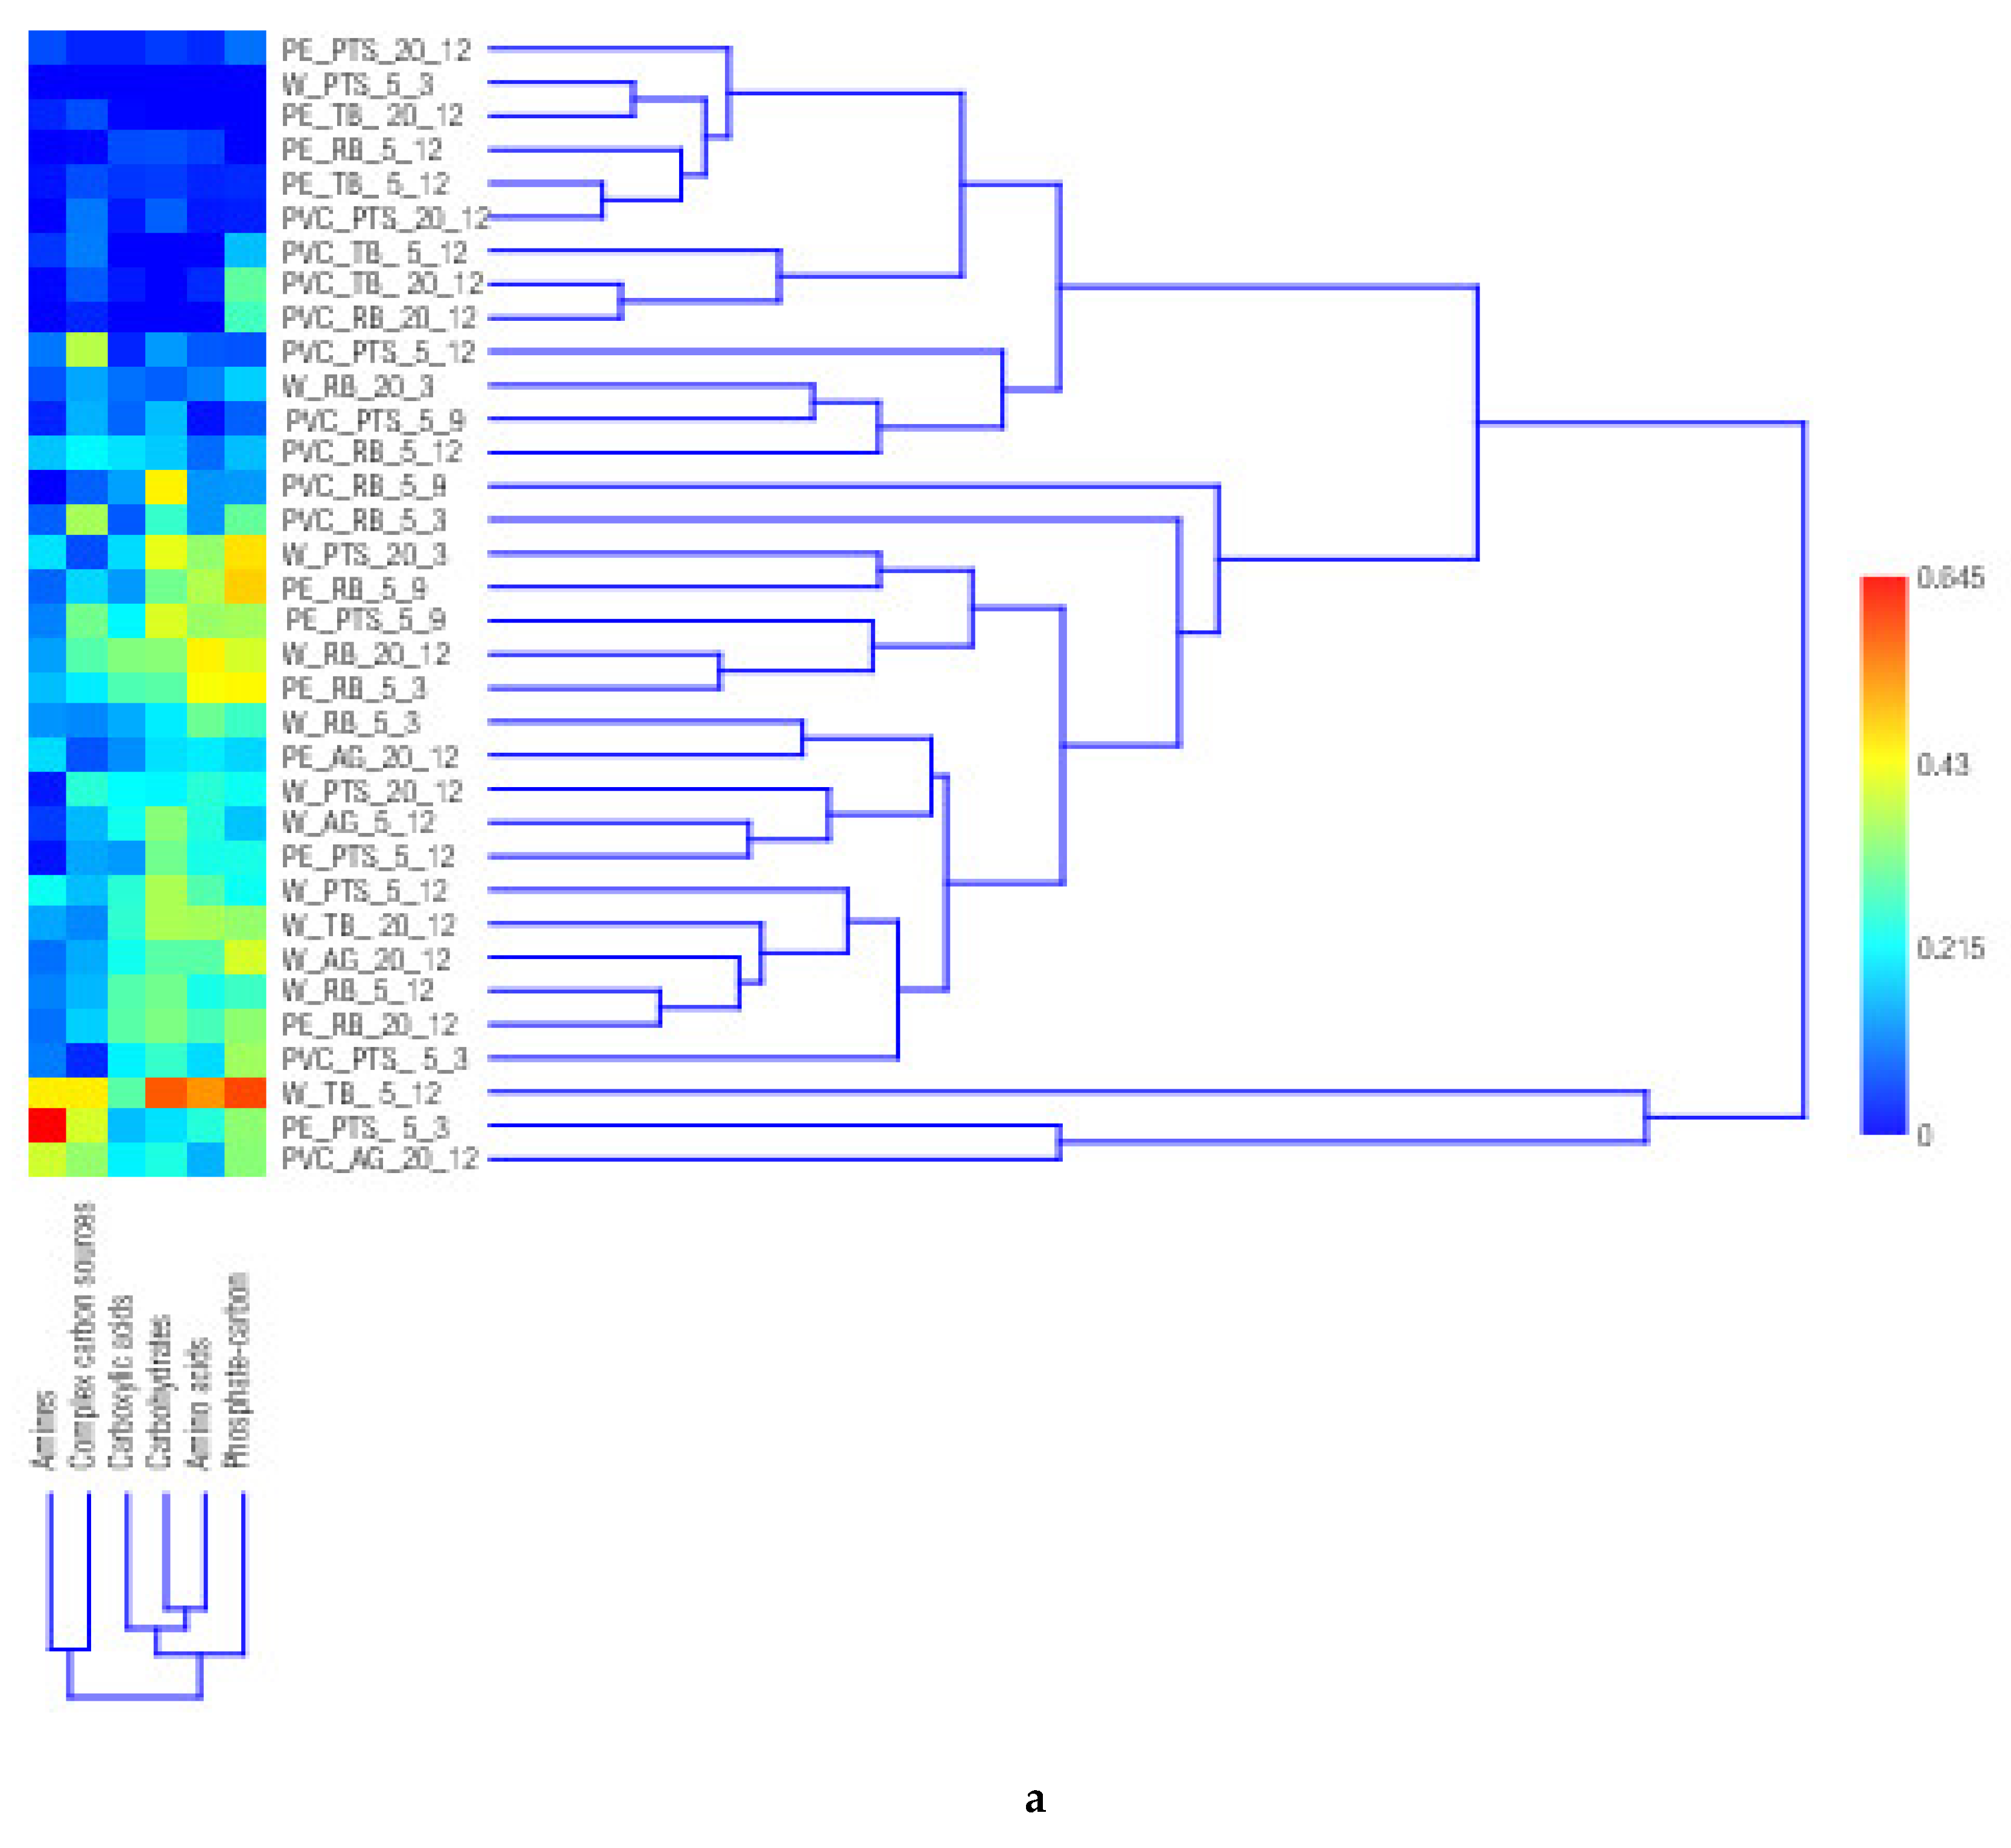
3.5. Statistical Analysis

NMDS of the community-level profiles allowed us to identify (Figure 5a) two main clusters in the RB area showing a heterogenous, mixed composition, one of which consisted of two sub-groups of samples that differed reciprocally on a time scale (T3 versus T9-T12); therefore, no clear separation was observed in the microbial physiological traits according to the sampling site and polymer type (PVC, PE). The pelagic community (RB_5m, and PTS_5 and 20 m, all at T12) remained unclustered.
ANOVA of community metabolic patterns confirmed that within the RB area microbial community, metabolism varied significantly among the matrices (F = 10.38, p = 3.61 × 10⁻⁵); Tukey’s pairwise comparisons showed that the PVC-associated biofilm community differed significantly from the PE-associated one (4.67, p = 0.0027) as well as from the community inhabiting the surrounding waters (6.11, p = 6.50 × 10⁻⁵).
Also, within the TB area (Figure 5b), NMDS outputs showed that the metabolic profiles of the plastisphere community were separated from the pelagic ones. This finding was confirmed by ANOVA results (F = 83.31, p = 4.92 × 10⁻²⁹ water versus biofilm), which showed more significant differences between PE and water communities (Tukey’s 16.87, p = 2.17 × 10⁻⁵) compared to PVC and water (Tukey’s 14.48, p = 2.15 × 10⁻⁵). Repeated measure analysis on RB_5m and PTS_5m samples showed the lack of significant differences over time in the metabolic profiles at each station separately (RB: F = 0.679, p = 0.511 and PTS: F = 2.015, p = 0.142) (Table S1 in Supplementary Materials).
Hierarchical clustering of the metabolic profiles of the microbial community of all the collected (biofilm and water) samples highlighted more diversified patterns in the water compared to the biofilm community (Figure 6a). Carbon substrate utilization rates were particularly low in PE-associated biofilm at the TB station and in PVC-associated biofilm at the PTS and TB stations. Globally, the heterogeneous composition of the clusters confirmed that the PE-associated community metabolism was more comparable to the water community metabolism rather than to the PVC-associated community, as well as that the metabolic profiles were not ruled by a single driver (polymer type or station). In more detail, the profiles of the PVC-associated microbial community (Figure 6b) pointed out close relationships occurring between amino acids, carboxylic acids, and amines, while phosphate-carbon, carbohydrates and complex carbon sources appeared reciprocally isolated. Close links were also found at T12 both at greater depths between the TB and RB stations and at 5 m between RB and PTS stations. Peak values of utilization of carbon substrates were recorded for carbohydrates at RB-5m at T9 and for amines and complex carbon sources at AG-20m at T12. Complex carbon sources were also metabolised effectively at both RB and PTS stations at 5 m. Globally, the lowest metabolic rates were observed at the TB, RB and PTS stations at T12 at 20 m.
Higher utilization rates were detected in PE-associated community (Figure 6c) compared to PVC. Hierarchical clustering showed that in the metabolic profiles of the PE-associated community there were close associations between phosphate-carbon, amino acids and carbohydrates, while amines appeared quite isolated. Sample PTS-5m at T3 differed, exhibiting a peak value of amine utilization; close relationships occurred between RB (5 m) and TB (5 m and 20 m) stations at T12, all characterized by low metabolic profiles.
Looking at the metabolic profiles of the pelagic microbial community (Figure 6d), carboxylic acids, complex carbon sources and amines were clustered separately from phosphate-carbon, amino acids and carbohydrates that grouped together, like what was observed for PE-associated microbes. Sample TB_5m at T12 appeared isolated, showing high metabolic levels.
Regarding the diversity of the microbial community physiological profiles (Table 2 and Figure S3), the pelagic community showed an average Margalef index of 13.40 compared to 16.89 and 17.61 of PVC and PE, respectively; opposite trends were observed for the number of utilised substrates—indicating the functional richness—which was on average 30, 24 and 26 for water, PVC and PE, respectively. The metabolic diversity indices of the PVC-associated microbial community measured in the Road Bay area showed similar d values between RB and PTS stations, while the PE-associated one was more diverse—although not significantly—at RB than PTS stations. In this area, at 5 m the metabolic diversity of PVC-associated microbes varied between 13.08 and 15.62 at PTS station and between 13.43 and 15.47 at station RB; at 20 m, diversity increased at the PTS station (d = 26.02), while it decreased at the RB one (d = 11.42). On PE panels, at the PTS and RB stations at 5 m the microbial biofilm showed generally lower diversity values than PVC ones, except for a peak of 17.26 at station RB at T12, while the highest ones (d = 32.51) were recorded at station PTS_20m. Within the TB area, high metabolic diversity was observed in the PVC-associated microbial community. In the same area, diversity indices increased in PE-associated microbes.
The pelagic community d index showed similar values among the samples in the Road Bay are, except for the RB station at 20 m where high diversity was found at T12 (d = 19.20). Like what observed in Road Bay area, in Tethys Bay area there was also no significant variability in the diversity values, apart from a peak value of 13.67 at station AG_20m.
Evenness (J′) values depicted similar distributions for the plastisphere communities (average values 0.918 and 0.912 for PVC and PE, respectively), compared to the pelagic one (0.955).
Shannon’s diversity index (H′) was, in a decreasing order, water community > PE > PVC biofilm community, varying, on average, from 3.238 (pelagic community) to 2.926 and 2.811 (PE and PVC biofilm community, respectively).

4. Discussion

Functional diversity studies focus on the diversity of the functional traits of microbial community linked to the adaptive strategies that microorganisms may use from both an evolutionary and ecological point of view [42]; the metabolic profiles of microbes are, indeed, a functional trait that characterizes each community and may vary depending on the composition of the same community as well as on the environmental properties such as temperature, salinity, nutrient availability. Plastics’ surface represents a suitable substrate for microbial colonization, as documented by previous studies [2,7,11,43,44]. Within the wide scientific literature on plastisphere, however, functional diversity of microbial biofilms has been the subject of a few studies only [13,20,29,30], and even more limited is the understanding of microbial colonization currently available in polar environments [7,16,17,21,45,46]. This research is a first contribute to fill up current knowledge gaps on the functional diversity of microbial biofilm community harboured in two Ross Sea areas exposed to different environmental scenarios such as the presence of a glacier and of a source of human impact from the Zucchelli station. To this end, the Biolog Ecoplate method was used to explore the community-level physiological profiles in terms of the microbial ability to utilize a spectrum of different organic compounds as a carbon source. Exploratory studies of the microbial biofilms’ metabolic patterns could be of interest not only from a strictly ecological point of view but also to assess the potential of microbial functions for bioprospecting purposes [47]. Our working hypothesis was that the functional diversity of the plastisphere was affected by the polymer type and/or the sampling site.
In the following sections, the patterns of carbon substrate utilization are discussed in relation to the sampling sites and matrices (plastic polymers versus water) as well as to the sampling time.

4.1. Comparison between Sampling Stations and among Matrices

In this study, a substantial similarity in the carbon substrate utilization profiles of the microbial community among the RB and TB areas was evidenced by the statistical analysis. Therefore, the variable “sampling station” did not seem to shape the functional diversity of the microbial community at a statistically significant level, although the hierarchical cluster analysis suggested that the microbial metabolic profiles measured at the RB and AG impact stations were functionally different from those of the relative control stations (PTS and TB, respectively). Conversely, the variable “matrix” was found to significantly affect the metabolic patterns of the plastic-associated community. Carbohydrates, phosphate carbon and amino acids were the most metabolised categories of organic substrates both by PE-associated and pelagic microbial community, while complex carbon sources, carbohydrates and phosphate-carbon were the most utilised carbon sources by the PVC-associated microbial community. The similarity observed between the metabolic profiles of pelagic and PE-associated biofilm communities suggested that the surrounding waters are the main source of the microbial community colonizing PE panels.
This study aimed at determining the community-level physiological profiles as a metabolic fingerprinting of the microbial community; in addition, as a further proof of the ability of marine bacteria to produce biofilm, some bacterial strains were isolated on Marine agar plates and screened for their biofilm production using a conventional laboratory procedure based on crystal violet staining [48,49]. Higher biofilm production was detected in the bacterial strains isolated from RB compared to PTS station (as shown by optical density values (average ± standard deviation) of 0.80 ± 0.51 and 0.28 ± 0.15, respectively), as well as in those isolated from water (optical density of 0.87 ± 0.61), compared to PVC and PE-associated bacteria (0.56 ± 0.46 and 0.50 ± 0.14, respectively) [50]. Bacterial isolates were further presumptively identified according to biochemical identification schemes for marine heterotrophic bacteria [51,52]. Most of the bacterial isolates colonizing PVC were identified as Micrococcus spp., Moraxella spp., Pseudoalteromonas spp., Arthrobacter spp.; PE-associated bacteria were identified as Staphylococcus spp.; water isolates were ascribable to Vibrio spp., Pseudomonas spp., Flavobacterium spp., Moraxella spp.
Despite the low temperature and low nutrient concentrations, Antarctic water ecosystems host a wide diversity of microbial life; microorganisms, including bacteria, algae and protozoa, colonize several different habitats [22]. Microorganisms play a relevant role as the primary decomposers, so it is important to determine the categories of organic compounds which can be degraded by the whole community in the environment. The metabolic activity patterns can be related to the composition of the organic carbon pool and its bioavailability to the microbial community. Nowadays, it is widely recognized that the metabolism of a community is greater than that of the individuals included in the community [53]. Among the individual carbon sources, in this study only 12.90% (4 of 31) of the different Biolog Ecoplates substrates were used by PVC-associated microbes, while 19.35% (6 of 31) were used by PE-associated ones; conversely, 70.97% of the substrates (22 of 31) were metabolized by the pelagic community. This finding suggested that, despite the lack of significant differences in the community metabolic profiles, a trend towards a selective colonization of the plastic substrates by specialised species showing common functions might be envisaged in our experiment. A comparative study of bacterial colonization in aquatic environments on natural substrates and on PVC [54] pointed out that the PVC-colonizing bacterial species showed similar functions and tend to establish cooperative interactions with respect to the natural one.
The overall metabolic response of the microbial community examined in our study was low. This finding could be attributable to environmental constrains strictly linked to the main extreme conditions in terms of temperature fluctuations, freezing-thawing cycles, since environmental stressors, especially in cold environments, are known to inhibit or reduce microbial community functionality [55,56]. The best exploited carbon sources were the polymeric substrates like complex carbon sources, carbohydrates and amines. These finding are in line with results obtained in Antarctic soils [57] and in deep Antarctic permafrost [31]. The capability to utilize amines suggested the occurrence of nitrogen compounds, nitrifying bacteria and an active nitrogen fixation; in a similar way, the discrete utilization of carboxylic acids, and among them the pyruvic acid, indicated the occurrence of methanogens, as previously reported in Arctic pelagic areas [58].
Biolog Ecoplates were previously applied to determine the profiles of soil and ice from maritime Antarctica [59], and hypersaline brines of the Victoria Land [31,32].
In east continental Antarctica (coastal outcrops of the Lützow-Holm Bay, Queen Maud Land), the metabolic diversity of the microbial community has recently been explored [60]; the profiles showed that L-arginine, L-asparagine, Tween 40 and 80, D-mannitol and D-galacturonic acid were the most utilized carbon sources.
Microbial communities inhabiting Antarctic cryoconite holes exhibited scarcely diversified substrate utilization patterns [61]: about 23% of the tested substrates were metabolised, which belonged to carbohydrates (such as pyruvic acid methyl ester, D-Cellobiose, D-Mannitol), amino acids (such as L Asparagine, Glycyl-L-glutamic acid) and complex carbon sources (Tween 40, Tween 80). Conversely, a great versatility of substrate utilization characterized the biofilm community, suggesting its ability to also exploit heterogeneous organic matter, like the DOM present in mountain glaciers, which is generally known to be a chemically heterogeneous matrix.
Regarding the categories of metabolized substrates, metabolic profiles are closely related to the physiological adaptive features of microorganisms that are known to support their survival in cold environments. Carbohydrates and complex carbon sources were reported to be the most used compounds in other polar regions, such as the Franklin Bay (Canadian Arctic) [35,62]; in addition, polymers such as Tween 40 were commonly metabolised by the bacterial community.
In the western Antarctic waters during late spring 2002, phenolic compounds such as 2-hydroxy benzoic acid and 4-hydroxy benzoic acid were the most metabolised carbon sources [35]. High utilization rates were observed for complex carbon sources such as Tween 40, glycogen and α-cyclodextrin; in addition, carbohydrates such as N-acetyl-D-glucosamine and D-cellobiose, amines such as phenylethylamine and putrescine, and L-phenylalanine within the amino acids were also actively metabolised. Conversely, D-galactonic acid, I-erythritol, L-arginine, L-asparagine and D-malic acid were not utilized. Moreover, the functional bacterial diversity was not directly driven by the phytoplankton biomass, but rather carbon sources other than phytoplankton-derived DOC were the main carbon sources exploited by the bacterial community.
Concerning the diversity indices, these were calculated to provide a quick estimation of the functional diversity of the microbial community; the plastisphere metabolic diversity showed that this microbial matrix may play an active role in the biogeochemical processes; at the same time, it could represent a potential source of new enzymes for the decomposition of plastic wastes but this topic needs further investigations.
In soil close to Wanda Glacier, Antarctic Peninsula, Pessi et al. [59] highlighted that the community-level physiological profiles and the diversity indices of the bacteria assemblage pointed out a heterogeneous distribution pattern of the microbial community distribution in the study area; moreover, the soil chemical properties were suggested as the main drivers of the observed differences in the carbon substrate utilization patterns. D-xylose, pyruvic acid methyl ester, putrescine, 2-hydroxy benzoic acid, Tween 40, and Tween 80 were metabolized by the microbial communities. Distinct metabolic patterns were observed even in reciprocally close samples, confirming the heterogeneous distribution of microorganisms in extreme natural environments [63]. The lower diversity index obtained in some samples (i.e., PE, RB 5 m T12) could be explained by the chemical properties (lower C availability) of the samples or by a lower richness, i.e., fewer functional groups of microorganisms or a high percentage of psychrotrophic (cold-tolerant) microorganisms, in analogy to what suggested by Pessi et al. [59].
In soil biofilms, high Shannon diversity and evenness indices together with enhanced microbial activity (as respiratory activity) were recorded, confirming the active biogeochemical role of the biofilm microbial community [64].
In the bacterial communities associated with Svalbard fjord sediments (Arctic), N-acetyl-D-glucosamine, D-mannitol and Tween-80 were the most utilized carbon substrates [65]. These authors detected a lower bacterial diversity in the fjord sediments (Shannon index 4.5–5.37) than in the terrestrial ones (7.935–8.135). N-acetyl-D-glucosamine is an amino sugar acting as a carbon and energy source that is used by bacteria to synthesize surface cell structure [66]. Among marine bacteria, its uptake was commonly found [67]. The utilization of Tween 80 and 40, polyol compounds, is a very frequent phenotypical trait expressed by polar microorganisms [59,62]; this is an adaptive characteristic allowing bacterial survival in extreme Arctic environments [68]. Cold-adapted bacteria may accumulate the sugar mannitol in their cytoplasm to avoid water loss and cell shrinkage during freezing [69].
Substrates such as glycogen, α-cyclodextrin and D-cellobiose were utilized by Arctic fjord sediment communities, suggesting the presence of bacteria able to degrade complex compounds [65,70,71]. Metabolic activity on pyruvic acid methyl ester, D-glucosaminic acid, D-galactonic acid-gamma lactone, L-arginine, L-asparagine, and L-serine was also reported in Arctic terrestrial sediment communities [60]; the utilization of D-mannitol, N-acetyl-D-glucosamine, and Tween 80 by both terrestrial and fjord sediment communities suggested that such carbon substrates were readily available in these cold sedimentary environments.
Carbohydrates and amino acids yielded the highest number of positive results in the substrate utilization patterns by the bacterioplankton harbouring the Amundsen Gulf waters (western Arctic) [72]; cellobiose, glucose, maltose, sucrose, glycogen and N-acetyl-D-glucosamine were the substrates most metabolised, while amino acids were occasionally utilised. Overall, the polysaccharides were the organic substrates that supported most the heterotrophic bacterial assemblage during the Arctic winter.

4.2. Variability in Community Metabolic Profiles over a Temporal Scale

Only for the RB area, the microbial colonization experiment enabled us to follow how microbial metabolism evolves over time. This study also provided insights into the functional role of the biofilm community metabolism and how the metabolic potential changes with biofilm development. Higher substrate utilization rates were recorded in the pioneering biofilm community recovered 3 months after panels’ deployment (late austral summer period) than after 12 months, leading us to suppose that extreme environmental conditions during autumn and spring negatively affected foulers’ metabolism.
Seasonal changes in substrate utilization patterns were recorded in the Amundsen Gulf (western Arctic), with low utilization rates in winter, increasing during spring and peaking in summer. The utilization of all categories of substrates was low in winter, except for L-leucine which gave more positive results in winter than in spring [72].

5. Conclusions

The metabolic profiles determined in this study showed differences in carbon source utilization patterns between water and plastisphere (PVC, PE) communities. The functional diversity of the pelagic community was comparatively low. A substantial lack of differences in the carbon substrate utilization profiles of the microbial community between the studied areas confirmed that the sampling site did not play a significant role as a driver of microbial community metabolism; conversely, the variable matrix appeared to be more relevant in affecting the functional diversity of the microbial community. The similarity between the metabolic profiles of pelagic and PE-associated communities suggested that the surrounding waters are the main source of the microbial community colonizing PE. The observed metabolic profiles probably reflected a different composition of the prokaryotic community, that is, in turn, affected by a complex interplay between the fouling members and the environmental conditions such as the range of the substrates available in the varying natural environment. Future experiments extending the period of observations to longer time periods are suggested to confirm current obtained trends and improve data interpretation in the light of the changing environmental scenarios.
The good degradative ability towards complex carbon substrates and polymers found in the physiological profiles of the PVC- and PE-plastisphere community suggests potential applications of the biofilm members in bioremediation and might pave the way for new and promising future bioprospecting studies.

Supplementary Materials

The following supporting information can be downloaded at https://www.mdpi.com/article/10.3390/jmse11071317/s1, Figure S1: Heatmaps of the community metabolic patterns of PVC-associated (A,B) and PE-associated microbial biofilms (C,D) compared to the pelagic microbial community (E,F); Figure S2: Heatmaps showing the single carbon substrate utilized by the PVC-associated (A,B) and PE-associated microbial biofilms (C,D) compared to the pelagic microbial community (E,F); Table S1: Outputs of Repeated Measures Analysis of Variance (ANOVA) performed on the microbial community profiles measured in Road Bay area; Figure S3: Diversity plots of the microbial community metabolic profiles associated to each matrix (Polyvynyl chloride, PVC; Polyethylene, PE; Water).

Author Contributions

Conceptualization, G.C., G.M. and M.A.; methodology, all the authors; validation, G.M. and A.C.R.; formal analysis, G.C., G.M. and A.C.R.; investigation, O.D. and M.A.; resources, G.C.; data curation, A.C.R., G.C. and P.L.; writing—original draft preparation, all the authors; writing—review and editing, all the authors; supervision, G.M., A.C.R. and G.C.; project administration, G.C.; funding acquisition, G.C. All authors have read and agreed to the published version of the manuscript.

Funding

This research was funded by the Programma Nazionale di Ricerche in Antartide (PNRA), Italian Ministry of University and Research “Microbial colonization of Antarctic benthic environments: response of microbial abundances, diversity, activities and larval settlement to natural and anthropogenic disturbances and search for secondary metabolites”, acronym_ ANT_Biofilm) (grant number PNRA16_00105).

Institutional Review Board Statement

Not applicable.

Informed Consent Statement

Not applicable.

Data Availability Statement

Data are available upon request. Data have been deposited at the PNRA website, Italian Antarctic Data Center (https://iandc.pnra.aq/srv/ita/catalog.search#/home (accessed on 17 March 2023)).

Acknowledgments

The authors are grateful to the ENEA operators (Casaccia, Rome) for their invaluable support with logistic operations and scuba-diving during the research activities and to Gerard Pichon (Barbier group, Sainte-Sigolène, France), who provided the polyethylene coupons used in this experiment.

Conflicts of Interest

The authors declare no conflict of interest. The funders had no role in the design of the study; in the collection, analyses, or interpretation of data; in the writing of the manuscript, or in the decision to publish the results.

References

  1. Salta, M.; Wharton, J.A.; Blache, Y.; Stokes, K.R.; Briand, J.-F. Marine biofilms on artificial surfaces: Structure and dynamics. Environ. Microbiol. 2013, 15, 2879–2893. [Google Scholar] [CrossRef] [PubMed]
  2. Dos Santos, A.L.S.; Galdino, A.C.M.; de Mello, T.P.; de Ramos, L.S.; Branquinha, M.H.; Bolognese, A.M.; Neto, J.C.; Roudbary, M. What are the advantages of living in a community? A microbial biofilm perspective! Mem. Inst. Oswaldo Cruz 2018, 113, 1–7. [Google Scholar] [CrossRef] [PubMed]
  3. Dang, H.; Lovell, C.R. Microbial surface colonization and biofilm development in marine environments. Microbiol. Mol. Biol. Rev. 2016, 80, 91–138. [Google Scholar] [CrossRef]
  4. Suaria, G.; Perold, V.; Lee, J.R.; Lebouard, F.; Aliani, S.; Ryan, P.G. Floating macro- and microplastics around the Southern Ocean: Results from the Antarctic Circumnavigation Expedition. Environ. Int. 2020, 136, 105494. [Google Scholar] [CrossRef] [PubMed]
  5. Mammo, F.K.; Amoah, I.D.; Gani, K.M.; Pillay, L.; Ratha, S.K.; Bux, F.; Kumari, S. Microplastics in the environment: Interactions with microbes and chemical contaminants. Sci. Total Environ. 2020, 743, 140518. [Google Scholar] [CrossRef]
  6. Corsi, I.; Bergami, E.; Caruso, G. Plastics in polar regions. Environ. Int. 2021, 149, 106203. [Google Scholar] [CrossRef]
  7. Caruso, G. Microbial Colonization in Marine Environments: Overview of Current Knowledge and Emerging Research Topics. J. Mar. Sci. Eng. 2020, 8, 78. [Google Scholar] [CrossRef]
  8. Caruso, G.; Bergami, E.; Singh, N.; Corsi, I. Plastic Occurrence, Sources, and Impacts in Antarctic Environment and Biota. Water Biol. Secur. 2022, 1, 100034. [Google Scholar] [CrossRef]
  9. Bargagli, R.; Rota, E. Microplastic interactions and possible combined biological effects in Antarctic marine ecosystems. Animals 2023, 3, 162. [Google Scholar] [CrossRef]
  10. Caruso, G. Microplastics as vectors of contaminants. Mar. Pollut. Bull. 2019, 146, 921–924. [Google Scholar] [CrossRef]
  11. Zettler, E.R.; Mincer, T.J.; Amaral-Zettler, L.A. Life in the “Plastisphere”: Microbial Communities on Plastic Marine Debris. Environ. Sci. Technol. 2013, 47, 7137–7146. [Google Scholar] [CrossRef]
  12. Harrison, J.P.; Hoellein, T.J.; Sapp, M.; Tagg, A.S.; Ju-Nam, Y.; Ojeda, J.J. Microplastic-Associated Biofilms: A Comparison of Freshwater and Marine Environments. In Handbook of Environmental Chemistry; Barcelò, D., Kostianoy, A.G., Eds.; Springer: Cham, Germany, 2018; Volume 58, pp. 181–201. [Google Scholar] [CrossRef]
  13. Oberbeckmann, S.; Labrenz, M. Marine Microbial Assemblages on Microplastics: Diversity, Adaptation, and Role in Degradation. Ann. Rev. Mar. Sci. 2020, 12, 209–232. [Google Scholar] [CrossRef]
  14. Pinto, M.; Langer, T.M.; Hüer, T.; Hofmann, T.; Herndl, G.J. The composition of bacterial communities associated with plastic biofilms differs between different polymers and stages of biofilm succession. PLoS ONE 2019, 14, e0217165. [Google Scholar] [CrossRef] [PubMed]
  15. Bergmann, M.; Collard, F.; Fabres, J.; Gabrielsen, G.W.; Provencher, J.F.; Rochman, C.M.; van Sebille, E.; Tekman, M.B. Plastic pollution in the Arctic. Nat. Rev. Earth Environ. 2022, 3, 323–337. [Google Scholar] [CrossRef]
  16. Webster, N.S.; Negri, A.P. Site-specific variation in Antarctic marine biofilms established on artificial surfaces. Environ. Microbiol. 2006, 8, 1177–1190. [Google Scholar] [CrossRef]
  17. Lee, Y.M.; Cho, K.H.; Hwang, K.; Kim, E.H.; Kim, M.; Hong, S.G.; Lee, H.K. Succession of bacterial community structure during the early stage of biofilm development in the Antarctic marine environment. Korean J. Microbiol. 2016, 52, 49–58. [Google Scholar] [CrossRef]
  18. Clark, M.S.; Villota Nieva, L.; Hoffman, J.I.; Davies, A.J.; Trivedi, U.J.; Turner, F.; Ashton, G.V.; Peck, L.S. Lack of long-term acclimation in Antarctic encrusting species suggests vulnerability to warming. Nat. Commun. 2019, 10, 3383. [Google Scholar] [CrossRef]
  19. Amaral-Zettler, L.A.; Zettler, E.R.; Slikas, B.; Boyd, G.D.; Melvin, D.W.; Morrall, C.E.; Proskurowski, G.; Mincer, T.J. The biogeography of the Plastisphere: Implications for policy. Front. Ecol. Environ. 2015, 13, 541–546. [Google Scholar] [CrossRef]
  20. Amaral-Zettler, L.A.; Zettler, E.R.; Mincer, T.J. Ecology of the plastisphere. Nat. Rev. Microbiol. 2020, 18, 139–151. [Google Scholar] [CrossRef]
  21. Cappello, S.; Caruso, G.; Bergami, E.; Macrì, A.; Venuti, V.; Majolino, D.; Corsi, I. New insights into the structure and function of the prokaryotic communities colonizing plastic debris collected in King George Island (Antarctica): Preliminary observations from two plastic fragments. J. Hazard. Mat. 2021, 414, 125586. [Google Scholar] [CrossRef]
  22. Cavicchioli, R. Microbial ecology of Antarctic aquatic systems. Nat. Rev. Microbiol. 2015, 13, 691–706. [Google Scholar] [CrossRef] [PubMed]
  23. Smith, W.O., Jr.; Sedwick, P.N.; Arrigo, K.R.; Ainley, D.G.; Orsi, A.H. The Ross Sea in a sea of change. Oceanography 2012, 25, 90–103. [Google Scholar] [CrossRef]
  24. Fabiano, M.; Danovaro, R. Enzymatic Activity, Bacterial Distribution, and Organic Matter Composition in Sediments of the Ross Sea (Antarctica). Appl. Environ. Microbiol. 1998, 64, 3838–3845. [Google Scholar] [CrossRef] [PubMed]
  25. Celussi, M.; Cataletto, B.; Fonda Umani, S.; Del Negro, P. Depth profiles of bacterioplankton assemblages and their activities in the Ross Sea. Deep Sea Res. Part I 2009, 56, 2193–2205. [Google Scholar] [CrossRef]
  26. Celussi, M.; Bergamasco, A.; Cataletto, B.; Umani, S.F.; Del Negro, P. Water masses’ bacterial community structure and microbial activities in the Ross Sea, Antarctica. Antarct. Sci. 2010, 22, 361–370. [Google Scholar] [CrossRef]
  27. Azzaro, M.; Specchiulli, A.; Maimone, G.; Azzaro, F.; Lo Giudice, A.; Papale, M.; La Ferla, R.; Paranhos, R.; Souza Cabral, A.; Rappazzo, A.C.; et al. Trophic and Microbial Patterns in the Ross Sea Area (Antarctica): Spatial Variability during the Summer Season. J. Mar. Sci. Eng. 2022, 10, 1666. [Google Scholar] [CrossRef]
  28. Cummings, V.J.; Hewitt, J.E.; Thrush, S.F.; Marriott, P.M.; Halliday, N.J.; Norkko, A. Linking Ross Sea Coastal Benthic Communities to Environmental Conditions: Documenting Baselines in a Spatially Variable and Changing World. Front. Mar. Sci. 2018, 5, 232. [Google Scholar] [CrossRef]
  29. Ylla, I.; Canhoto, C.; Romaní, A.M. Effects of warming on stream biofilm organic matter use capabilities. Microb. Ecol. 2014, 68, 132–145. [Google Scholar] [CrossRef]
  30. Romaní, A.M.; Borrego, C.M.; Diaz-Villanueva, V.; Freixa, A.; Gich, F.; Ylla, I. Shifts in microbial community structure and function in light- and dark-grown biofilms driven by warming. Environ. Microbiol. 2014, 16, 2550–2567. [Google Scholar] [CrossRef]
  31. La Ferla, R.; Azzaro, M.; Michaud, L.; Caruso, G.; Lo Giudice, A.; Paranhos, R.; Cabral, A.S.; Conte, A.; Cosenza, A.; Maimone, G.; et al. Prokaryotic Abundance and Activity in Permafrost of the Northern Victoria Land and Upper Victoria Valley (Antarctica). Microb. Ecol. 2017, 74, 402–415. [Google Scholar] [CrossRef]
  32. Papale, M.; Lo Giudice, A.; Conte, A.; Rizzo, C.; Rappazzo, A.C.; Maimone, G.; Caruso, G.; La Ferla, R.; Azzaro, M.; Gugliandolo, C.; et al. Microbial Assemblages in Pressurized Antarctic Brine Pockets (Tarn Flat, Northern Victoria Land): A Hotspot of Biodiversity and Activity. Microorganisms 2019, 7, 333. [Google Scholar] [CrossRef]
  33. Garland, J.L.; Mills, A.L. Classification and characterization of heterotrophic microbial communities on the basis of patterns of community-level sole-carbon-source utilization. Appl. Environ. Microbiol. 1991, 57, 2351–2359. [Google Scholar] [CrossRef] [PubMed]
  34. Garland, J.L. Analytical approaches to the characterization of samples of microbial communities using patterns of potential C source utilization. Soil Biol. Biochem. 1996, 28, 213–221. [Google Scholar] [CrossRef]
  35. Sala, M.M.; Arin, L.; Balagué, V.; Felipe, J.; Guadayol, O.; Vaqué, D. Functional diversity of bacterioplankton assemblages in Western Antarctic seawaters during late spring. Mar. Ecol. Progr. Ser. 2005, 292, 13–21. [Google Scholar] [CrossRef]
  36. Sala, M.M.; Estrada, M.; Gasol, J.M. Seasonal changes in the functional diversity of bacterioplankton in contrasting coastal environments of the NW Mediterranean. Aquat. Microb. Ecol. 2006, 44, 1–9. [Google Scholar] [CrossRef]
  37. Hammer, Ø.; Harper, D.A.T.; Ryan, P.D. PAST: Paleontological Statistics Software package for education and data analysis. Paleontol. Electron. 2001, 4, 1–9. [Google Scholar]
  38. Clarke, K.R.; Gorley, R.N.; Somerfield, P.J.; Warwick, R.M. Change in Marine Communities: An Approach to Statistical Analysis and Interpretation, 3rd ed.; PRIMER-E Ltd.: Plymouth, UK, 2014. [Google Scholar]
  39. Margalef, R. Ecología; Omega: Barcelona, Spain, 1977; pp. 1–951. [Google Scholar]
  40. Ludwig, J.A.; Reynolds, J.F. Statistical Ecology: A Primer on Methods and Computing; Wiley: New York, NY, USA, 1988; pp. 85–106. [Google Scholar]
  41. Pielou, E.C. Ecological Diversity; John Wiley & Sons: New York, NY, USA, 1975. [Google Scholar]
  42. Zanne, A.E.; Abarenkov, K.; Afkhami, M.E.; Aguilar-Trigueros, C.A.; Bates, S.; Bhatnagar, J.M.; Busby, P.E.; Christian, N.; Cornwell, W.K.; Crowther, T.W.; et al. Fungal functional ecology: Bringing a trait-based approach to plant-associated fungi. Biol. Rev. 2020, 95, 409–433. [Google Scholar] [CrossRef] [PubMed]
  43. Anderson, M.J. Variations in biofilms colonizing artificial surfaces: Seasonal effects and effects of grazers. J. Mar. Biol. Ass. 1995, 75, 705–714. [Google Scholar] [CrossRef]
  44. Caruso, G.; Pedà, C.; Cappello, S.; Leonardi, M.; La Ferla, R.; Giudice, A.L.; Maricchiolo, G.; Rizzo, C.; Maimone, G.; Rappazzo, A.C.; et al. Effects of microplastics on trophic parameters, abundance and metabolic activities of seawater and fish gut bacteria in mesocosm conditions. Environ. Sci. Pollut. Res. 2018, 25, 30067–30083. [Google Scholar] [CrossRef]
  45. Caroppo, C.; Azzaro, M.; Dell’Acqua, O.; Azzaro, F.; Maimone, G.; Rappazzo, A.C.; Raffa, F.; Caruso, G. Microbial Biofilms Colonizing Plastic Substrates in the Ross Sea (Antarctica). J. Mar. Sci. Eng. 2022, 10, 1714. [Google Scholar] [CrossRef]
  46. Caruso, G.; Dell’Acqua, O.; Caruso, R.; Azzaro, M. Phenotypic characterization of bacterial isolates from marine waters and plastisphere communities of the Ross Sea (Antarctica). J. Clin. Microbiol. Biochem. Technol. 2022, 8, 001–009. [Google Scholar] [CrossRef]
  47. Zhang, W.; Ding, W.; Li, Y.-X.; Tam, C.; Bougouffa, S.; Wang, R.; Pei, B.; Chiang, H.; Leung, P.; Lu, Y.; et al. Marine biofilms constitute a bank of hidden microbial diversity and functional potential. Nat. Commun. 2019, 10, 517. [Google Scholar] [CrossRef]
  48. Laganà, P.; Votano, L.; Caruso, G.; Azzaro, M.; Lo Giudice, A.; Delia, S. Bacterial isolates from the Arctic region (Pasvik River, Norway): Assessment of biofilm production and antibiotic susceptibility profiles. Environ. Sci. Pollut. Res. 2018, 25, 1089–1102. [Google Scholar] [CrossRef]
  49. Sottile, C. Evaluation of the Capacity of Producing Biofilm in Bacterial Strains from the Antarctica (In Italian). Bachelor’s Thesis, University of Messina, Department of Chemical, Biological, Pharmaceutical and Environmental Sciences, Messina, Italy, 2020; pp. 1–61. [Google Scholar]
  50. Caruso, G. Microbial Colonization of Antarctic Benthic Environments: Response of Microbial Abundances, Diversity, Activities and Larval Settlement to Natural and Anthropogenic Disturbances and Search for Secondary Metabolites (ANT-Biofilm, PNRA16_00105); Final Scientific Report; Programma Nazionale di Ricerche in Antartide (PNRA): Rome, Italy, 2020; Available online: https://www.pnra.aq/en/project/335/microbial-colonization-benthic-environments-antarctica-responses-microbial-abundances (accessed on 15 March 2023).
  51. Oliver, J.D. Taxonomic scheme for the identification of marine bacteria. Deep Sea Res. Part A Oceanogr. Res. Pap. 1982, 29, 795–798. [Google Scholar] [CrossRef]
  52. Sujarit, D.; Lyla, P.; Khan, S. A simple scheme for the identification of marine heterotrophic bacteria. Thalassas 2007, 23, 17–21. [Google Scholar]
  53. Litchfield, C.D.; Irby, A.; Kis-Papo, T.; Oren, A. Comparative metabolic diversity in two solar salterns. Hydrobiologia 2001, 466, 73–80. [Google Scholar] [CrossRef]
  54. Miao, L.; Wang, C.; Adyel, T.; Zhao, J.; Yan, N.; Wu, J.; Hou, J. Periphytic biofilm formation on natural and artificial substrates: Comparison of microbial composition, interaction, and function. Front. Microbiol. 2021, 12, 1917. [Google Scholar] [CrossRef] [PubMed]
  55. Gilichinsky, D.; Vishnivetskaya, T.; Petrova, M. Bacteria in permafrost. In Psychrophiles: From Biodiversity to Biotechnology; Margesin, R., Schinner, F., Marx, J.C., Gerday, C., Eds.; Springer: Berlin/Heidelberg, Germany, 2008; pp. 83–102. [Google Scholar]
  56. Jałowiecki, Ł.; Chojniak, J.M.; Dorgeloh, E.; Hegedusova, B.; Ejhed, H.; Magnér, J.; Płaza, G.A. Microbial community profiles in wastewaters from onsite wastewater treatment systems technology. PLoS ONE 2016, 11, e0147725. [Google Scholar] [CrossRef] [PubMed]
  57. Kenarova, A.; Encheva, M.; Chipeva, V. Physiological diversity of bacterial communities from different soil locations on Livingston Island, South Shetland archipelago, Antarctica. Polar Biol. 2013, 36, 223–233. [Google Scholar] [CrossRef]
  58. Papale, M.; Caruso, G.; Maimone, G.; La Ferla, R.; Giudice, A.L.; Rappazzo, A.C.; Cosenza, A.; Azzaro, F.; Ferretti, R.; Paranhos, R.; et al. Microbial Community Abundance and Metabolism Close to the Ice-Water Interface of the Blomstrandbreen Glacier (Kongsfjorden, Svalbard): A Sampling Survey Using an Unmanned Autonomous Vehicle. Water 2023, 15, 556. [Google Scholar] [CrossRef]
  59. Pessi, I.S.; De Oliveira Elias, S.; Simoes, F.L.; Simoes, J.C.; Macedo, A.J. Functional diversity of microbial communities in soils in the vicinity of Wanda Glacier, Antarctic Peninsula. Microbes Environ. 2012, 27, 200–203. [Google Scholar] [CrossRef] [PubMed]
  60. Nagata, Y.; Osono, T.; Hasegawa, M.; Hobara, S.; Hirose, D.; Tanabe, Y.; Kudoh, S.; Uchida, M. Application of the Biolog EcoPlate™ technique for assessing the microbial metabolic diversity in moss profiles of continental Antarctica. Polar Sci. 2023, 35, 100924. [Google Scholar] [CrossRef]
  61. Sanyal, A.; Antony, R.; Samui, G.; Thamban, M. Microbial communities and their potential for degradation of dissolved organic carbon in cryoconite hole environments of Himalaya and Antarctica. Microbiol. Res. 2018, 208, 32–42. [Google Scholar] [CrossRef] [PubMed]
  62. Sala, M.M.; Terrado, R.; Lovejoy, C.; Unrein, F.; Pedrớs-Aliớ, C. Metabolic diversity of heterotrophic bacterioplankton over winter and spring in the coastal Arctic Ocean. Environ. Microbiol. 2008, 10, 942–949. [Google Scholar] [CrossRef]
  63. Yergeau, E.; Kowalchuk, G.A. Responses of Antarctic soil microbial communities and associated functions to temperature and freeze-thaw cycle frequency. Environ. Microbiol. 2008, 10, 2223–2235. [Google Scholar] [CrossRef]
  64. Wu, Y.; Cai, P.; Jing, X.; Niu, X.; Ji, D.; Ashry, N.M.; Gao, C.; Huang, Q. Soil biofilm formation enhances microbial community diversity and metabolic activity. Environ. Int. 2019, 132, 105116. [Google Scholar] [CrossRef]
  65. Thomas, F.A.; Mohan, M.; Krishnan, K.P. Bacterial diversity and their metabolic profiles in the sedimentary environments of Ny-Ålesund, Arctic. Antonie Van Leeuwenhoek 2021, 114, 1339–1360. [Google Scholar] [CrossRef]
  66. A’lvarez-Añorve, L.I.; Calcagno, M.L.; Plumbridge, J. Why does Escherichia coli grow more slowly on glucosamine than on N-acetylglucosamine? Effects of enzyme levels and allosteric activation of GlcN6P deaminase (NagB) on growth rates. J. Bacteriol. 2005, 187, 2974–2982. [Google Scholar] [CrossRef]
  67. Cottrell, M.T.; Moore, J.A.; Kirchman, D.L. Chitinases from Uncultured Marine Microorganisms. Am. Soc. Microbiol. 1999, 65, 2553–2557. [Google Scholar] [CrossRef]
  68. Reitermayer, D.; Kafka, T.A.; Lenz, C.A.; Vogel, R.F. Interrelation between Tween and the membrane properties and high pressure tolerance of Lactobacillus plantarum. BMC Microbiol. 2018, 18, 72. [Google Scholar] [CrossRef]
  69. Collins, T.; Margesin, R. Psychrophilic lifestyles: Mechanisms of adaptation and biotechnological tools. Appl. Microbiol. Biotechnol. 2019, 103, 2857–2871. [Google Scholar] [CrossRef] [PubMed]
  70. Teske, A.; Durbin, A.; Ziervogel, K.; Cox, C.; Arnosti, C. Microbial community composition and function in permanently cold seawater and sediments from an Arctic fjord of Svalbard. Appl. Environ. Microbiol. 2011, 77, 2008–2018. [Google Scholar] [CrossRef] [PubMed]
  71. Jain, A.; Krishnan, K.P. Differences in free-living and particle-associated bacterial communities and their spatial variation in Kongsfjorden, Arctic. J. Basic Microbiol. 2017, 57, 827–838. [Google Scholar] [CrossRef] [PubMed]
  72. Fernández-Gómez, B.; Sala, M.M.; Pedrós-Alió, C. Seasonal changes in substrate utilization patterns by bacterioplankton in the Amundsen Gulf (western Arctic). Polar Biol. 2014, 37, 1321–1329. [Google Scholar] [CrossRef]
Figure 1. Antarctic sites where the colonization experiment was performed. Modified from Google Earth (https://www.google.it/intl/it/earth/ (accessed on 20 November 2017)).
Jmse 11 01317 g001
Figure 2. (a,b). Box plot showing the trend of OD peak values of PVC-associated microbial biofilm in RB area (a) and TB area (b). For each box plot, the middle line, big squares, and vertical bars are reported, which represent the median value, 25% and 75% quartiles of the data, and minimum and maximum values, respectively.
Jmse 11 01317 g002
Figure 3. (a,b). Box plot showing the trend of OD peak values of PE-associated bacterial biofilm in RB area (a) and TB area (b). For each box plot, the middle line, big squares, and vertical bars are reported, which represent the median value, 25% and 75% quartiles of the data, and minimum and maximum values, respectively.
Jmse 11 01317 g003
Figure 4. (a,b). Box plot showing the trend of OD peak values of microbes in the waters of RB area (a) and TB area (b). For each box plot, the middle line, big squares, and vertical bars are reported, which represent the median value, 25% and 75% quartiles of the data, and minimum and maximum values, respectively.
Jmse 11 01317 g004
Figure 5. (a,b). Non-parametric multi-dimensional scaling (NMDS) based on Bray–Curtis dissimilarity of the community-level metabolic profiles of the microbial community according to the sampling stations (RB: Road Bay; PTS: Punta Stocchino; AG: Amorphous Glacier; TB: Tethys Bay) and to the matrix (biofilms on polyvynyl chloride, PVC; polyethylene, PE, panels; water) within the Road Bay area (a) and the Tethys Bay area (b).
Jmse 11 01317 g005
Figure 6. Hierarchical clustering of the metabolic profiles of (a), total (biofilm and water) samples; (b) PVC-associated microbial biofilm community; (c) PE-associated microbial biofilm community in comparison; and (d) pelagic microbial community.
Jmse 11 01317 g006aJmse 11 01317 g006b
Table 1. Incubation time (in hours) after which the peak values in absorbance were recorded.
StationPTSRBTBAG
PVC
5 m (T3)4848//
5 m (T9)4848//
5 m (T12)487272/
20 m (T12)048480/72
PE
5 m (T3)48336
5 m (T9)4848//
5 m (T12)484872/
20 m (T12)72482880/48
Water
5 m (T12)96964896
20 m (T12)1681689696
Table 2. Diversity indices (alpha-diversity) of the microbial community associated with each matrix (PVC, PE and water). D = Margalef diversity index; S = number of positive wells (richness); J′ = Pielou’s evenness, which is a measure of how evenly the species (in this case the substrates) are distributed in a community; H′ = Shannon’s diversity index.
PVCdSJ′H′ (log e)
PTS_ 5_313.08260.93923.060
PTS_5_915.62250.93012.994
PTS_5_1215.48260.90472.948
PTS_20_1226.02240.90002.860
RB_5_313.77280.94723.156
RB_5_913.43280.89722.990
RB_5_1215.47290.91963.096
RB_20_1211.42130.85772.200
AG_20_1212.99270.95943.162
TB_ 5_1232.40180.90152.606
TB_ 20_1216.16200.87582.624
PEdSJ′H′(log e)
PTS_ 5_38.79220.89822.776
PTS_5_913.03310.94333.239
PTS_5_1214.35300.90753.086
PTS_20_1232.51300.90983.094
RB_5_312.04270.96003.164
RB_5_913.34290.94333.176
RB_5_1217.2680.86831.806
RB_20_1213.56310.94643.250
AG_20_1216.32290.97073.269
TB_ 5_1234.94310.90053.092
TB_ 20_12 140.84712.236
WaterdSJ′H′(log e)
PTS_5_3 40.93231.292
PTS_5_1212.53310.95683.286
PTS_20_312.03270.95523.148
PTS_20_1212.69300.94833.225
RB_5_313.77280.97293.242
RB_5_1214.94310.92883.190
RB_20_319.20290.95953.231
RB_20_1212.15310.96283.306
AG_5_1212.91280.94513.149
AG_20_1213.67310.95083.265
TB_ 5_1211.24310.95803.290
TB_ 20_1212.35300.96653.287
Disclaimer/Publisher’s Note: The statements, opinions and data contained in all publications are solely those of the individual author(s) and contributor(s) and not of MDPI and/or the editor(s). MDPI and/or the editor(s) disclaim responsibility for any injury to people or property resulting from any ideas, methods, instructions or products referred to in the content.

