Green
Mapped: Carbon Dioxide Emissions Around the World
Article/Editing:
Click to view this graphic in a higher-resolution.
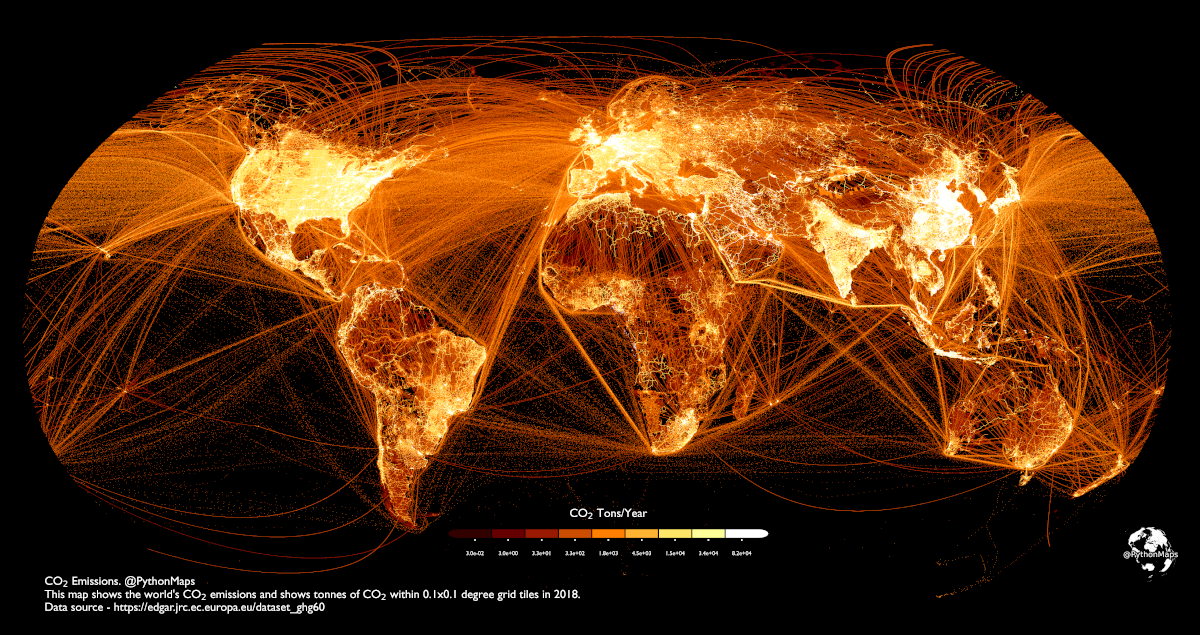
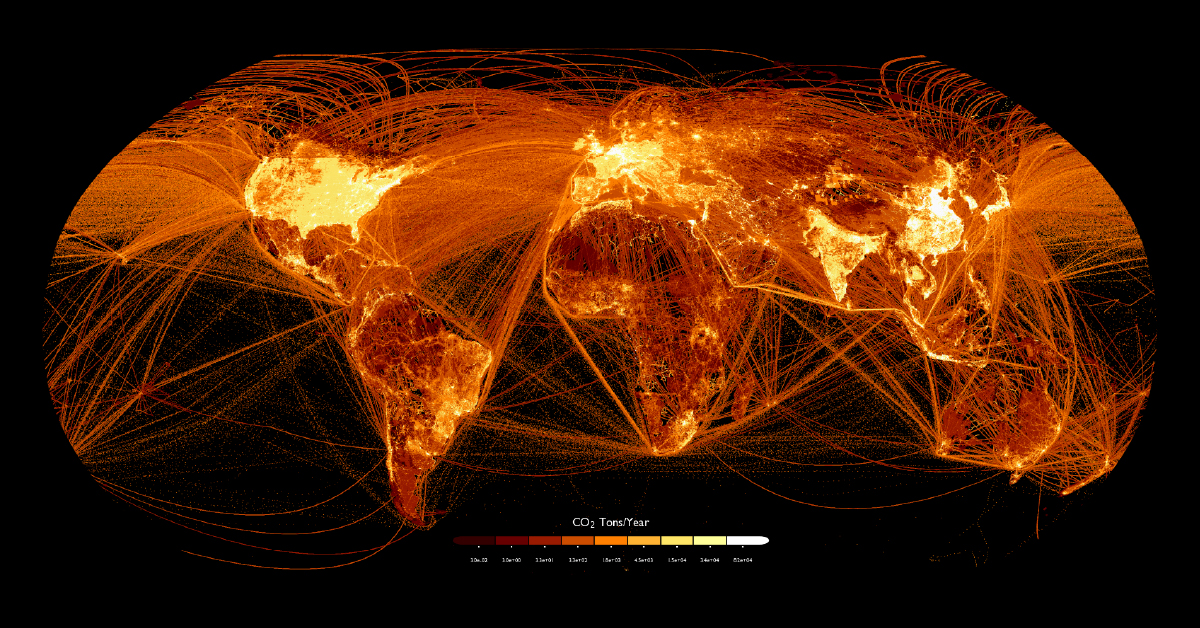
Mapped: Carbon Dioxide Emissions Around the World
According to Our World in Data, the global population emits about 34 billion tonnes of carbon dioxide (CO₂) each year.
Where does all this CO₂ come from? This graphic by Adam Symington maps out carbon emissions around the world, using 2018 data from the European Commission that tracks tonnes of CO₂ per 0.1 degree grid (roughly 11 square kilometers).
This type of visualization allows us to clearly see not just population centers, but flight paths, shipping lanes, and high production areas. Let’s take a closer look at some of these concentrated (and brightly lit) regions on the map.
China, India, and the Indian Ocean

As the two most populated countries and economic forces, China and India are both significant emitters of CO₂. China in particular accounts for about 27% of global CO₂ emissions.
And looking at the oceans, we see how much shipping adds to emissions, with many shipping lanes east of China clearly outlined as well as the major Indian Ocean lane between the Strait of Malacca and the Suez Canal.
The United States and Central America

The United States is one of the world’s biggest carbon emitters. While other countries like Qatar and Saudi Arabia technically have higher emissions per capita, their overall emissions are relatively low due to smaller populations.
Across the U.S., the most brightly lit areas are major population centers like the Boston-Washington corridor, the Bay Area, and the Great Lakes. But also lit up are many of the interconnecting highways linking all these population centers, even in the less-populated middle of the country.
With so much traffic in and out of the U.S., the oceans become a murky mix of shipping and flight paths. To the south, very clearly visible is the major concentration of people around Mexico City and the traffic flowing through the Panama Canal.
South America’s Network of Emissions
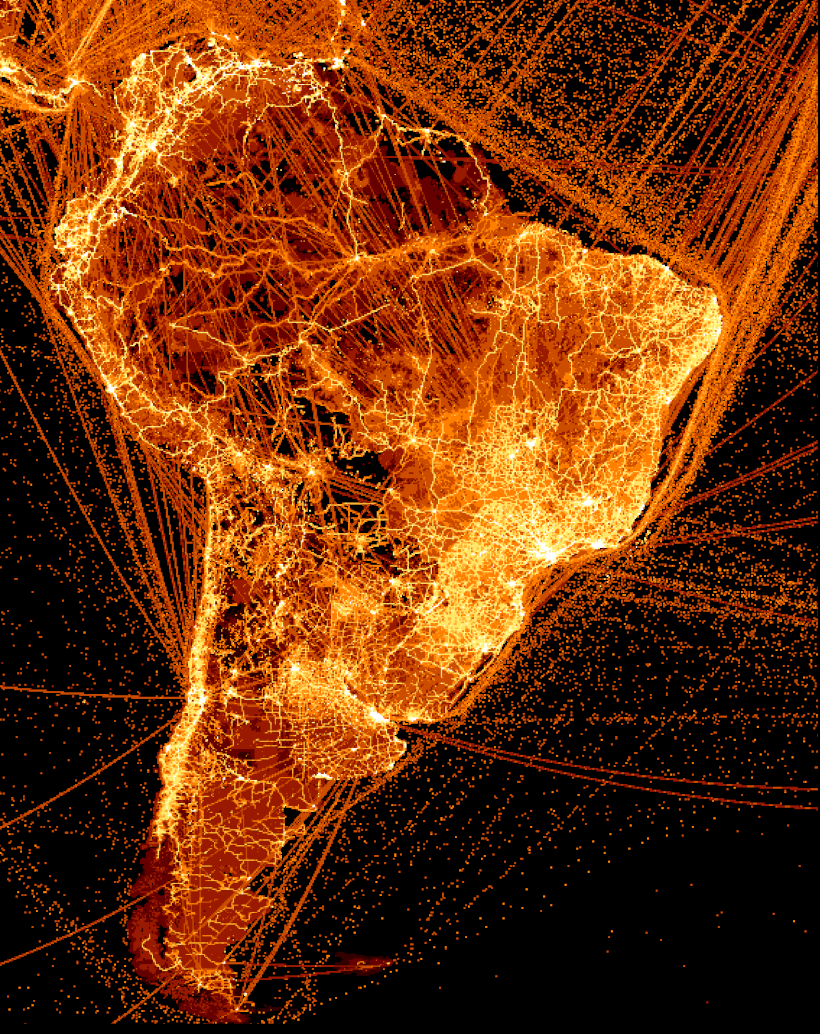
Like the other regions, some of South America’s most populated areas are also the biggest emitters, such as São Paulo and Rio in Brazil and Buenos Aires in Argentina. This map also highlights the continent’s rough terrain, with most of the population and highway emissions limited to the coasts.
However, the cities aren’t the only big emitters in the region. There are clear lines intersecting the Amazon forest in many sections where cities and roads were constructed, including the economic hub city of Manaus along the Amazon River. Likewise, the oceans have many major shipping lanes highlighted, particularly East of Brazil.
Europe and North Africa

Germany is one of Europe’s biggest carbon emitters—in 2021, the country generated almost 644 million tonnes of CO₂.
Also making an impression are Italy (which is the second-highest CO₂ emitter after Germany) and the UK, as well the significant amount of trade along the English Channel.
Compared to the intricate network of cities, towns, and bustling highways spanning Europe, across the Mediterranean are far clearer and simpler lines of activity in Northern Africa. Two major exceptions are in the Middle-East, where Egypt’s Nile River and Suez Canal are massively lit up, as well as Israel on the east of the sea.
But a more significant (albeit murkier) picture is drawn by the massive amounts of shipping and flight paths illuminating the Atlantic and Mediterranean at large.
Net Zero by 2050
To mitigate the negative effects of climate change, countries around the world have made commitments to reach net-zero emissions.
Imagining the global map of emissions with these commitments in action requires a complete transformation of energy production, consumption habits, transportation infrastructure, and more. And even then, a future generated map wouldn’t be fully dark, as “net-zero” is not equivalent to zero emissions but a balance of emissions and removal.
How might this map of global emissions look in the near and distant future? And what other interesting insights can you generate by browsing the world this way?

This article was published as a part of Visual Capitalist's Creator Program, which features data-driven visuals from some of our favorite Creators around the world.


Green
The Carbon Footprint of Major Travel Methods
Going on a cruise ship and flying domestically are the most carbon-intensive travel methods.


The Carbon Footprint of Major Travel Methods
This was originally posted on our Voronoi app. Download the app for free on iOS or Android and discover incredible data-driven charts from a variety of trusted sources.
Did you know that transport accounts for nearly one-quarter of global energy-related carbon dioxide (CO₂) emissions?
This graphic illustrates the carbon footprints of major travel methods measured in grams of carbon dioxide equivalent (CO₂e) emitted per person to travel one kilometer. This includes both CO₂ and other greenhouse gases.
Data is sourced from Our World in Data, the UK Government’s Department for Energy Security and Net Zero, and The International Council on Clean Transportation, as of December 2022.
These figures should be interpreted as approximations, rather than exact numbers. There are many variables at play that determine the actual carbon footprint in any individual case, including vehicle type or model, occupancy, energy mix, and even weather.
Cruise Ships are the Most Carbon-Intensive Travel Method
According to these estimates, taking a cruise ship, flying domestically, and driving alone are some of the most carbon-intensive travel methods.
Cruise ships typically use heavy fuel oil, which is high in carbon content. The average cruise ship weighs between 70,000 to 180,000 metric tons, meaning they require large engines to get moving.
These massive vessels must also generate power for onboard amenities such as lighting, air conditioning, and entertainment systems.
Short-haul flights are also considered carbon-intensive due to the significant amount of fuel consumed during initial takeoff and climbing altitude, relative to a lower amount of cruising.
| Transportation method | CO₂ equivalent emissions per passenger km |
|---|---|
| Cruise Ship | 250 |
| Short-haul flight (i.e. within a U.S. state or European country) | 246 |
| Diesel car | 171 |
| Gas car | 170 |
| Medium-haul flight (i.e. international travel within Europe, or between U.S. states) | 151 |
| Long-haul flight (over 3,700 km, about the distance from LA to NY) | 147 |
| Motorbike | 113 |
| Bus (average) | 96 |
| Plug-in hybrid | 68 |
| Electric car | 47 |
| National rail | 35 |
| Tram | 28 |
| London Underground | 27 |
| Ferry (foot passenger) | 19 |
| Eurostar (International rail) | 4.5 |
Are EVs Greener?
Many experts agree that EVs produce a lower carbon footprint over time versus traditional internal combustion engine (ICE) vehicles.
However, the batteries in electric vehicles charge on the power that comes straight off the electrical grid—which in many places may be powered by fossil fuels. For that reason, the carbon footprint of an EV will depend largely on the blend of electricity sources used for charging.
There are also questions about how energy-intensive it is to build EVs compared to a comparable ICE vehicle.

-

 Science1 week ago
Visualizing the Average Lifespans of Mammals
-

 Markets2 weeks ago
The Top 10 States by Real GDP Growth in 2023
-

 Demographics2 weeks ago
The Smallest Gender Wage Gaps in OECD Countries
-

 United States2 weeks ago
Where U.S. Inflation Hit the Hardest in March 2024
-

 Green2 weeks ago
Top Countries By Forest Growth Since 2001
-

 United States2 weeks ago
Ranked: The Largest U.S. Corporations by Number of Employees
-

 Maps2 weeks ago
The Largest Earthquakes in the New York Area (1970-2024)
-

 Green2 weeks ago
Ranked: The Countries With the Most Air Pollution in 2023