Ésta es una pequeña entrada futbolera para mirar el detalle de las votaciones para el premio FIFA The Best 2018 al mejor jugador del año, que fue ganado hace pocos días por Luka Modric.

¿Qué es lo que se premia?
De las reglas de FIFA para la organización del premio [PDF, 243 KB]:
Art. 2 The Awards reward the best in each category, regardless of championship or nationality, for their respective achievements during the period from 3 July 2017 to 15 July 2018 inclusive for the men’s awards and from 7 August 2017 to 24 May 2018 inclusive for the women’s awards.
Art. 3. The Awards are bestowed according to on-field performance and overall behaviour on and off the pitch.
Es por tanto una definición genérica: no se elige al que más goles meta, ni al que más títulos gane, ni al que gane el Mundial, ni la Super Copa de Europa, etc., se vota “al mejor por sus logros de acuerdo a la actuación en el campo y al comportamiento global dentro y fuera del terreno de juego”. A partir de ahí, cada uno vota al que quiera, siguiendo el procedimiento descrito a continuación.
¿Cómo se organiza la votación?
Según las reglas de FIFA para la organización del premio:
- Un panel de 13 expertos (1) selecciona una lista de 10 jugadores sobre la que después votaran capitanes, seleccionadores nacionales (coaches), periodistas (media) y aficionados (fans). (2)
- 168 capitanes de selecciones votaron a 3 jugadores de entre la lista de 10 elaborada por los expertos. Los clasificaron en primer, segundo y tercer lugar, obteniendo el jugador seleccionado 5, 3 y 1 puntos respectivamente.
- 171 seleccionadores nacionales votaron del mismo modo que los capitanes.
- 168 periodistas designados (uno por país) votaron del mismo modo que capitanes y seleccionadores.
- Aficionados de todo el mundo votaron en la web de FIFA.
- La votación tuvo lugar entre el 24 de julio y el 10 de agosto de 2018.
- El resultado final para la designación de los ganadores es una media ponderada en la que los resultados parciales de los votos de capitanes, seleccionadores, periodistas y aficionados pesa cada uno un 25% del total.
Por España votaron Sergio Ramos (capitán), Luis Enrique (seleccionador) y Francesc Aguilar (periodista de Mundo Deportivo).
El resultado global, es el publicado en diferentes medios, con un podio formado por Luka Modric (29.05% de los votos ponderados), Cristiano Ronaldo (19.08%) y Mohamed Salah (11.23%). Dejo debajo una tabla resumen. Esta misma tabla se puede descargar de la web de FIFA [PDF, 260 KB].

Por otro lado, en la web de FIFA se puede encontrar el detalle de todos los votos emitidos por capitanes, seleccionadores y periodistas, en un documento PDF de 16 páginas [PDF, 517 KB]. Y es a partir de ese documento del que muestro las tablas resumen de debajo.
Tabla resumen con el voto de los capitanes:
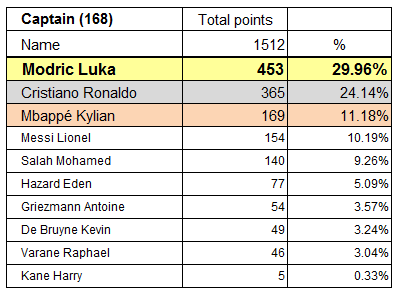
Tabla resumen con el voto de los capitanes, si solo votasen aquellos pertenecientes a las selecciones que disputaron el Mundial de Rusia 2018 (31 capitanes de entre los 168 de la muestra total):

Tabla resumen con el voto de los seleccionadores:

Tabla resumen con el voto de los seleccionadores, si solo votasen aquellos pertenecientes a las selecciones que disputaron el Mundial de Rusia 2018 (31 seleccionadores de entre los 171 de la muestra total):

Tabla resumen con el voto de los periodistas:

Tabla resumen con el voto de los aficionados:

Esta última tabla con el voto de los aficionados se obtiene a partir del resultado global y tras haber calculado los resultados parciales de capitanes, seleccionadores y prensa, dado que en los resultados de FIFA no aparece publicado el voto de aficionados.
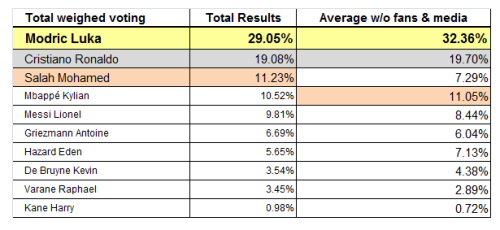
Comparación de la tabla resumen oficial con todos los votos con cómo quedaría la tabla si se excluyese de la ponderación el voto de los aficionados.

Comparación de la tabla resumen oficial con todos los votos con cómo quedaría la tabla si se excluyese de la ponderación el voto de los aficionados y la prensa, es decir, si contase sólo el voto de los profesionales.
Y por último una comparación con cómo quedaría la tabla si contase sólo el voto de los profesionales de aquellas selecciones que participaron en el Mundial de Rusia 2018 (los 31 capitanes y 31 seleccionadores).

Comentarios finales:
- En todas las votaciones aparecen destacados siempre en primer lugar Luka Modric y Cristiano Ronaldo con diferencia entre ellos y con el tercero.
- En el tercero y cuarto lugar aparecen distintos jugadores según se cojan los votos de capitanes, seleccionadores, prensa o capitanes y seleccionadores de las selecciones participantes en el Mundial: Salah & Mbappé, Mbappé & Messi, Salah & Varane, Mbappé & Hazard, Griezmann & Hazard, Mbappé & Griezmann.
- La excepción se da en el voto de los aficionados, donde en primer lugar destacado aparece Salah, seguido de lejos por Cristiano Ronaldo y Messi y en cuarto lugar Luka Modric.
—
(1) El panel de expertos [PDF, 402 KB] estaba formado por: Sami Al Jaber (Saudi Arabia), Emmanuel Amuneke (Nigeria), Cha Bum-Kun (Corea del Sur), Fabio Capello (Italia), Didier Drogba (Costa de Marfil), Kaka (Brasil), Frank Lampard (Inglaterra), Lothar Matthaus (Alemania), Alessandro Nesta (Italia), Carlos Alberto Parreira (Brasil), Ronaldo (Brasil), Andy Roxburgh (Escocia), Wynton Rufer (Nueva Zelanda).
(2) Una vez elaborada la lista todos los votos se circunscriben a ella, es por tanto normal que no haya votos para Neymar, Sergio Ramos, Isco o Cavani, dado que no forman parte de la lista hecha por el panel de expertos.